7 Best Trade Area Analysis Tools for Comparing Commercial Properties
Seven trade area analysis tools compared for commercial property teams, with each tool's evidence type and main constraint, plus guidance on setting consistent boundary rules.
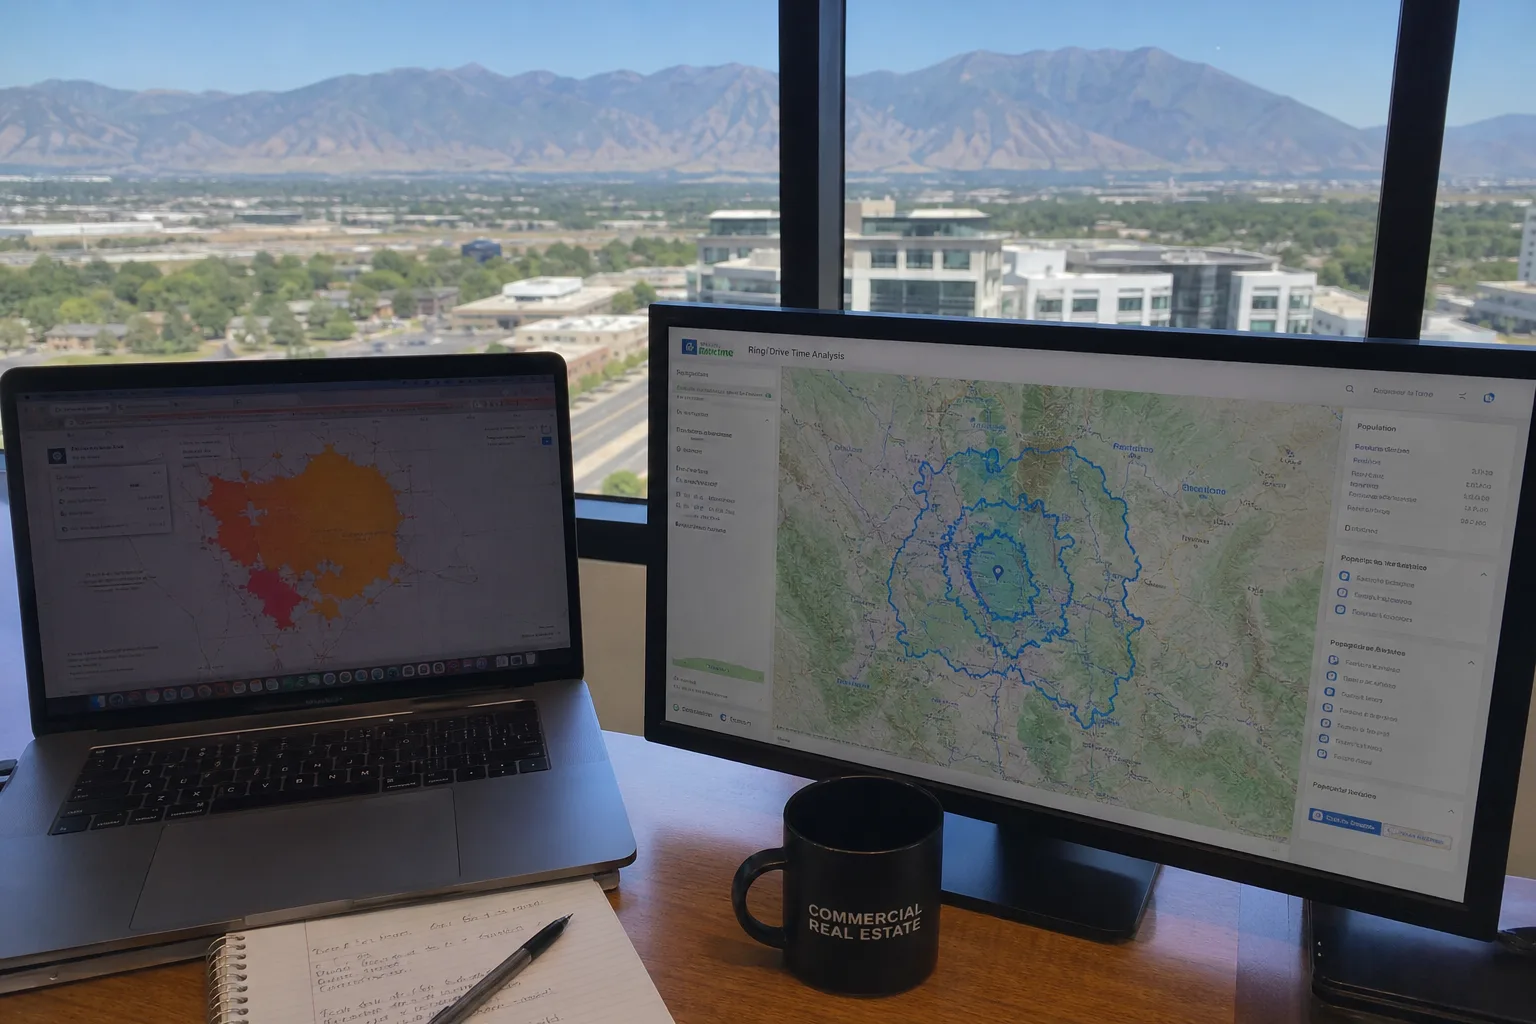
People who can reach a property and people who have visited it form different groups. A road-based travel area [1] helps estimate geographic reach. Visit data describes activity at a site that is open. Household data describes the people who live within a chosen boundary. Before comparing sites, the team needs to decide which of those questions its trade area should answer.
These seven tools address those questions in different ways. The choice depends on what the team needs to know, which data it has and who will keep the study up to date. Teams weighing a purchase can also start with fair market value basics.
Tool | Catchment Evidence | Main Constraint |
|---|---|---|
1. ArcGIS Business Analyst | Demographic and business data for site analysis | Edition and local data scope |
2. Placer.ai | Aggregate visitor activity around properties | Estimates rather than complete visitor counts |
3. CARTO | Supplied spatial data and repeatable operations | Analyst-owned data and service setup |
4. Maptive | Uploaded customers and properties with area context | Public viewing has daily allowances |
5. SiteSeer | Retail trade areas and modeled comparisons | Dataset and plan scope |
6. Kalibrate | Customer data, market evidence and site models | Client configuration and model requirements |
7. Smappen | Travel-time areas, demographics and points of interest | Advanced context requires higher plans |
Define the area and compare its contents
1. ArcGIS Business Analyst for demographic catchments
ArcGIS Business Analyst [2] is a strong choice when the team needs several kinds of market data around its sites. It combines the team's sites with data on residents, businesses, lifestyles and spending, including Census data. A team can use it to study a market as well as find nearby customers.
Begin with the question being tested and choose the measures that answer it. A household profile describes the people who live in an area. A count of business types describes the local mix of stores and services. Keep those measures separate so the team can explain which facts support its choice of site.
The web app accepts Excel or comma-separated point files with addresses or coordinates. It can also import sheets whose rows refer to standard areas. Choose that file route when the team wants to compare areas rather than plot a set of address pins.
Keep a small sheet beside the mapped areas, with a row for each site and the same measures in each column. Separate counts from shares and keep the meaning of each clear. A site may rank first because its trade area is larger, or because more of its residents belong to the group the team wants to reach. Those are different reasons to choose it, even if both produce a high rank.
Business Analyst's tools and license terms vary by edition. Web App Advanced includes Void Analysis, while the availability of data varies across countries. Point-file imports also have a 5-megabyte limit, and certain business-location exports consume credits. Choose the edition and the output the team needs before using it for a series of studies.
2. Placer.ai for visitor-based areas
Placer.ai uses data about groups of visits to study places that are open. A team comparing sites can use it to study activity at a store or chain alongside data on nearby homes and businesses.
Visit data answers its own question. People may travel from outside the area drawn around a store. Conversely, a nearby household is not evidence of a visit. A view based on visits and one based on residents can lead to different findings about the same site without either being wrong.
Placer.ai gets data from mobile-app partners and uses it to estimate wider patterns. It shows results for groups, without revealing who each person is. The team can study sites and chains through reports and a dashboard, or use other delivery options to bring the data into its own work.
The estimates do not count every visit or show what people bought. The free edition also covers only some properties and chains, with general data for the latest calendar month. Before buying access for a wider study, check which sites it covers and whether the contract permits sharing reports outside the firm.
3. CARTO for repeatable spatial comparisons
CARTO [3] suits a team that wants to set its own rules for comparing sites. Its Builder app maps data from a data warehouse. Workflows can count points inside polygons and perform other tasks. A saved process can apply the same rules to each site.
That helps when several sets of company data need the same treatment. The analyst can decide which records qualify as customers, which property areas belong in the comparison and which outside data may be joined. Saving those choices as part of the process helps the team use the same basis for each site.
The team still needs to prepare the data and its map features. A table of addresses needs a geocoding step to place them on the map. Coordinates need to be turned into the right spatial format. Some of those steps depend on which backend the team uses.
Platform use and location services are metered. Importing a file from a web address also brings it in once; it does not keep it linked to the source. CARTO is most useful where the team can keep both the data and the saved process up to date, and budget for the services each run uses.
Evaluate mapped customers and local markets
4. Maptive for customer and property overlap
Maptive helps teams compare their own customers with the sites they are considering. The analyst can import spreadsheet locations, filter the records and use supplied fields to distinguish the groups being examined. Radius circles and road-based drive-time areas provide different ways to study their distribution.
This approach can connect a candidate with the customer records the business already has. Numeric values can be summarized by area, while relevant Census or market layers add context. Keep company records distinct from estimates about the people who live nearby.
Commercial real estate mapping software [4] such as Maptive can show the chosen sites and customer groups in a shared map or an exported map image. The static image preserves a view for a report, while the shared map supports further inspection.
Daily allowances apply to public map views. Check the plan's view limit before sharing a map widely outside the team. The number of people who open it may be much larger than the group that prepared it.
5. SiteSeer for retail catchment comparisons
SiteSeer studies retail markets around defined trade areas. Its Professional platform includes site comparisons, scorecards, analog models and market potential. Radius, drive-time, specified-geography and drawn areas are available in its Void Analysis workflow.
For a property team, those choices help match the area to the tenant or store type being considered. A trade area used to investigate nearby business categories may differ from the area used to study a wider store network. Choose the view that fits the question.
SiteSeer also connects the retail inventory with ranked tenant matches and related scores. Those results help the team research prospects. They do not show that a tenant is interested or promise future sales. Data scope varies by country and dataset, with listed visitor-foot-traffic information limited to the United States. Check which data is available before comparing sites across borders.
6. Kalibrate for customer data and site models
Kalibrate Location Intelligence can combine customer and site records with data on rivals and other market sources. Excel data can be imported and geocoded, and a secure connection can maintain recurring uploads and downloads. This lets a team repeat its site studies as company records change.
Its reporting includes demographic, competitor and sales-forecast outputs. The team can also study its current sites, including plans to remodel, move or close them. It can then assess a new site alongside the network it has.
The sales-forecast reports use models developed and integrated for the client. The data licenses, chosen tools and user count affect what the team buys. Separate the customer data the team has from the data or model work it needs to buy. The forecast is still an estimate based on a model.
7. Smappen for business-user catchment maps
Smappen gives business users a direct way to draw and study areas. It creates travel-time, distance, drawn and administrative areas. The team can import Excel-based location records, then examine them in relation to the areas it has created.
The basic tiers show population counts. Pro and Advanced add more detailed charts about residents, point-of-interest search and custom metrics. A small study can start with fewer tools than a full market review needs.
The free tier permits 100 imported pins and ten active areas. Pin allowances apply across the company's users rather than separately to each map. Each country's data also has its own source dates. Check those limits when a first study grows into regular reviews of more sites or markets.
Use a consistent boundary rule for the decision
A useful comparison can include more than one trade-area view, provided their purposes remain clear. A fixed travel-time view asks how much of a market can reach each site under the same rule. Visit data asks where the people using an open site come from. Take care when using visits to explain reach, especially when a proposed site has no visit history of its own.
Record the boundary rule before comparing results. Use the same rules for which customers count, the same time period and the same meaning for each measure at every site. If an exception is necessary, state the reason beside the result rather than hide it inside the map setup.
Overlap deserves a separate check. A household or customer inside two candidate areas [5] may be counted in both individual site profiles. That can be appropriate for comparing the sites separately, but adding the profiles together would count the overlap again. Keep the figures for each site separate from an estimate for the whole network.
Test whether the chosen boundary changes the answer. If a small change in the reach rule reverses the site order, record that result. The team can then see which finding depends most on the area it chose, and decide whether more customer data would help settle the choice.
Keep a record of which result changed the site order. It may be customer reach, the mix of people or businesses, or a model estimate reviewed with the property terms. Save that result with its inputs so the team can revisit the choice when the site list or data changes. Investors managing multiple sites may also want to shortlist a property manager, and buyers watching financing can read how rate changes affect affordability. For a growing Utah market, see Washington, Utah.
References
Frequently asked questions
What is a trade area analysis in commercial real estate?
What is the difference between visit data and household data for site selection?
Which trade area tool is best for a small team?
How do I avoid double counting customers between two candidate sites?
How do I test whether my trade area boundary changes the site ranking?
Keep reading
More from the blog

Offer Accepted on a House: What Happens Next for Buyers
Environmental Due Diligence Before Buying Land

How a 1% Rate Increase Changes What Home You Can Afford