THIS is What's Happening in the Housing Market NOW — What Utah Buyers and Sellers Need to Know
Inventory Is Rising — What Utah Buyers & Sellers Need Now
Jason Walter examines the current state of the U.S. housing market, focusing on inventory trends, shifting competitiveness, and foreclosure activity. His analysis draws on data compiled by Resi Club Analytics using Realtor.com figures, and on New York Fed foreclosure data. This article distills those findings and interprets what they mean for buyers, sellers, and investors—especially those focused on Utah real estate.
Introduction and data sources
Recent market analysis from Resi Club Analytics (using Realtor.com inventory figures) shows inventory rising across the United States, with twelve states now reporting more homes for sale than before the pandemic. That increase partially explains the easing in home price growth and the price declines experienced in some overheated metros. Foreclosure trends are also relevant: New York Fed data compiled by Resi Club Analytics indicates foreclosures have been increasing gradually since moratoria ended, though current volumes remain far below the Great Recession peak. These datasets provide context for interpreting shifts in competitiveness and where opportunities may exist for buyers and sellers in Utah and beyond.
National inventory trends: moving toward pre-pandemic levels
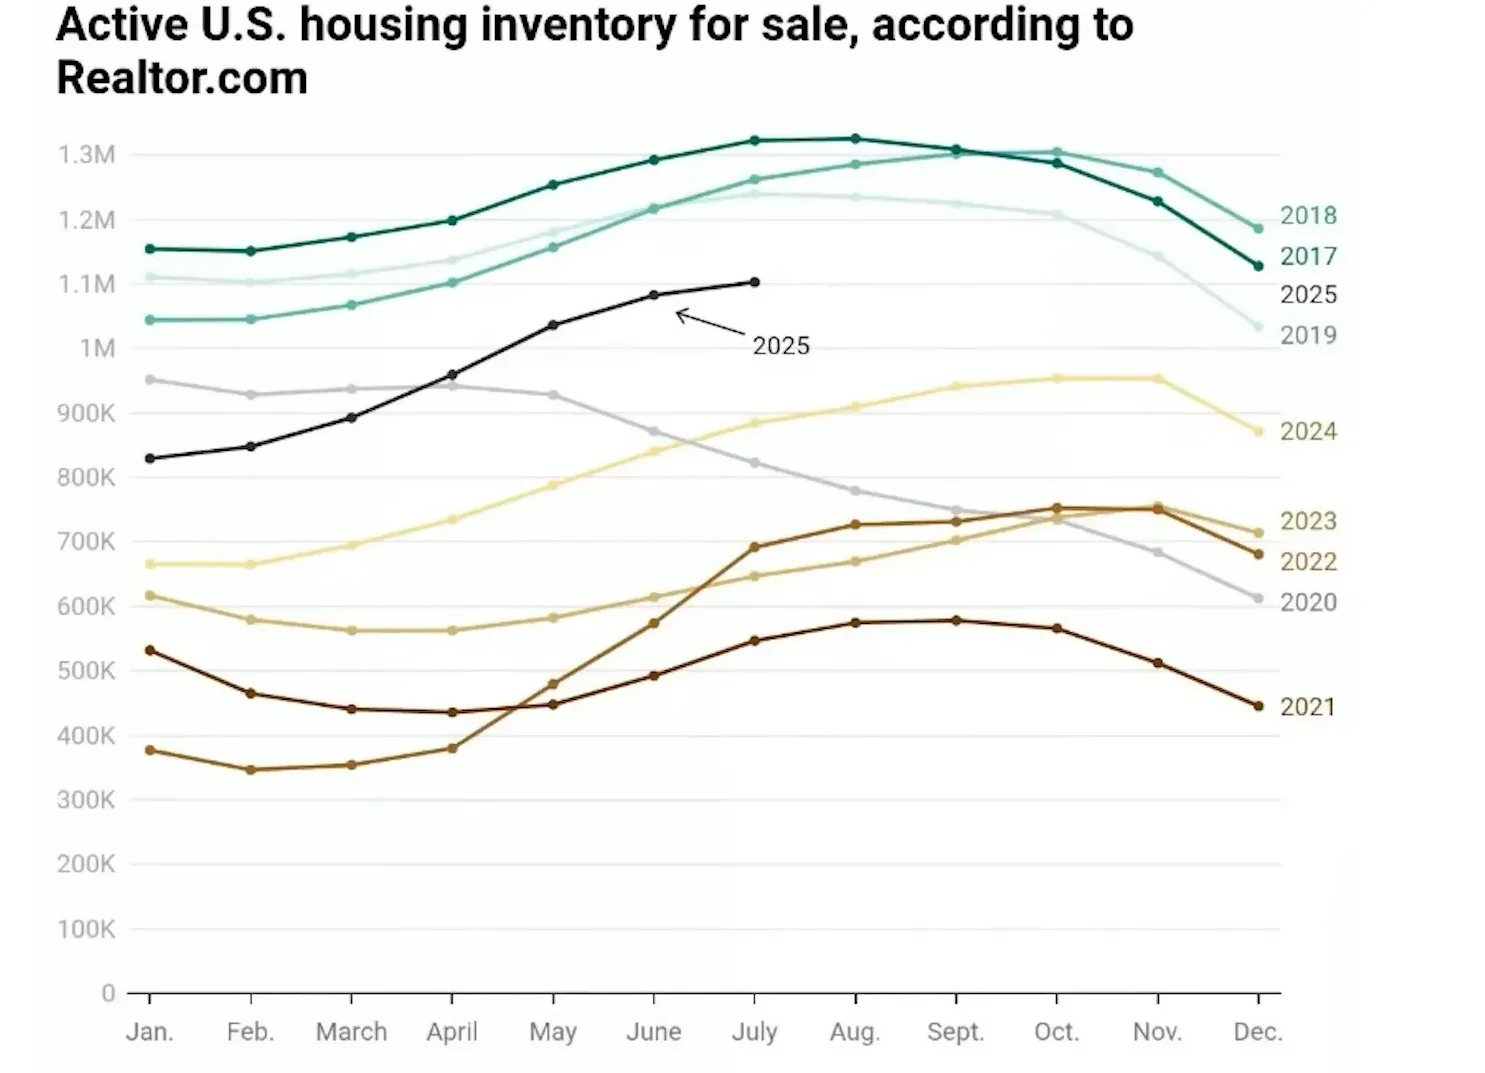
On a year-over-year basis, national inventory is up significantly—about 25% higher than the same period last year—yet it remains approximately 11% below typical pre-COVID (2019) levels. Instead of a sharp, sudden flood of listings, the market is experiencing a gradual normalization: more homes are entering the market compared to 2024, but total active inventory nationwide is still slightly constrained relative to 2019 benchmarks. Realtor.com data shows the U.S. currently has roughly 1.1 million active listings during the same seasonal timeframe when historically the market averaged about 1.25 million listings.
Why this matters
Inventory growth tends to reduce the intensity of bidding wars and slow headline price appreciation. Markets that have moved from chronic undersupply toward more balanced conditions typically offer buyers more choices and give sellers less margin for aggressive pricing strategies. For Utah—already experiencing notable inventory increases versus 2019—this means more neighborhoods may transition from hyper-competitive to buyer-favorable or balanced markets.
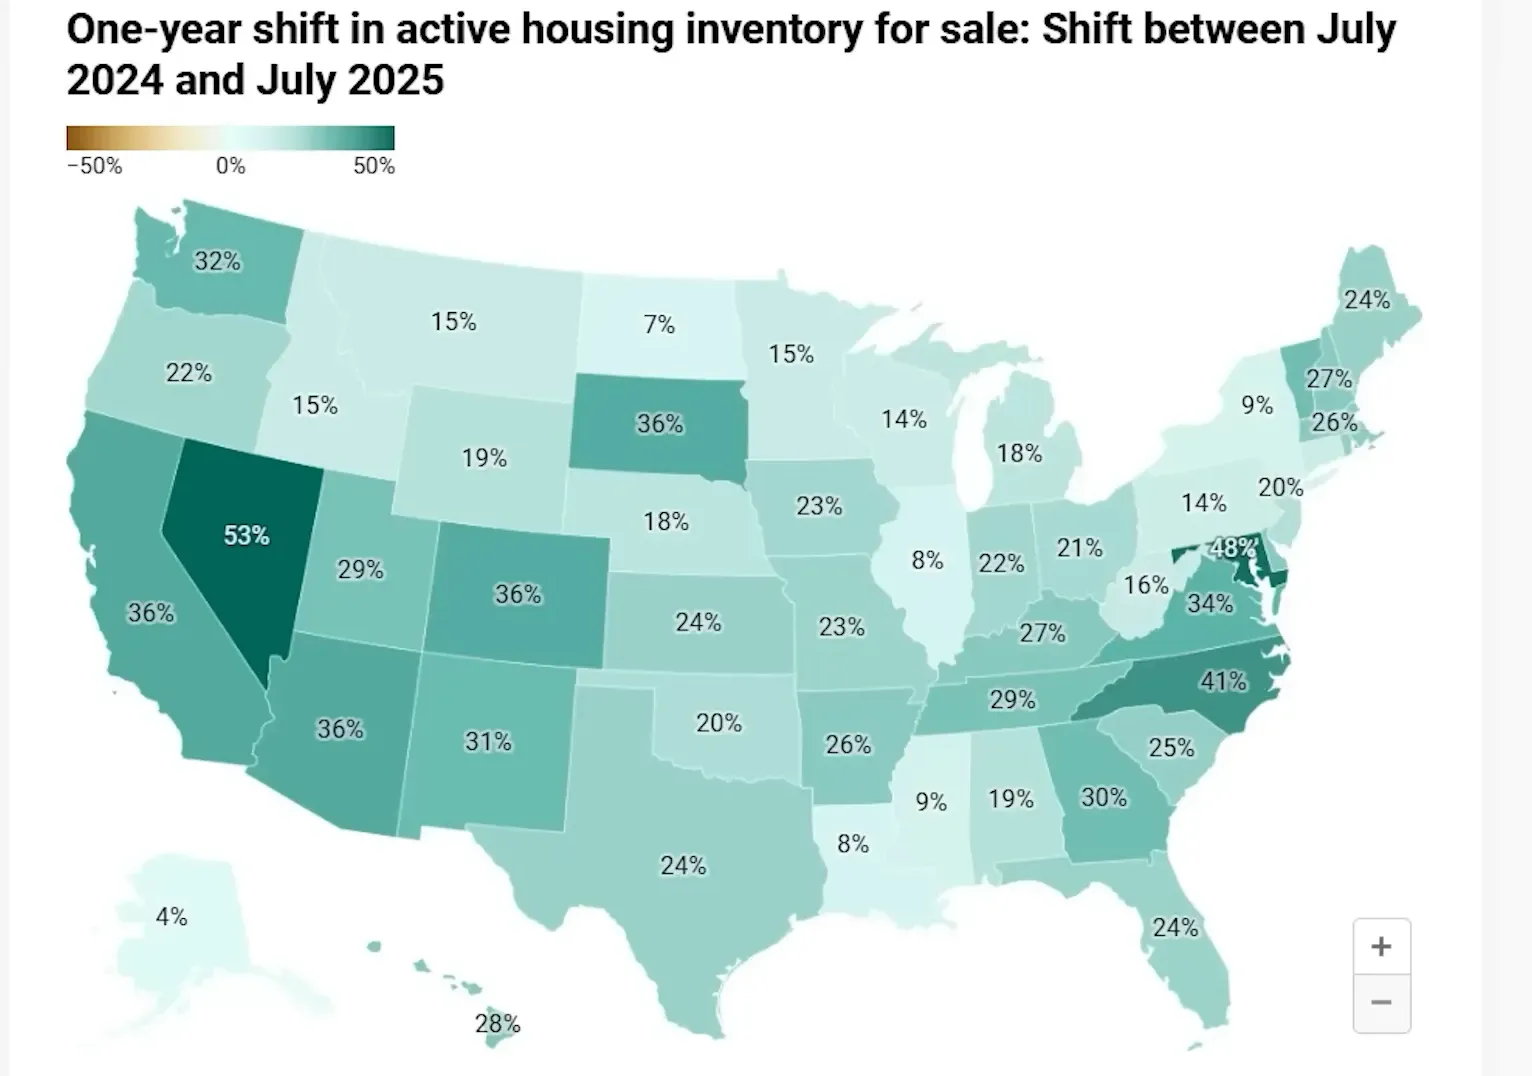
State- and metro-level shifts: where listings have risen the most
The national picture masks wide regional variation. Twelve states now report higher inventory than in 2019, but others remain well below pre-pandemic levels. Examples of notable changes versus 2019 include:
- California: up roughly 36% in inventory versus July 2019.
- Texas: up about 32% (roughly 141,000 homes for sale now vs. 107,000 in July 2019).
- Florida: up about 23.5% (around 174,000 homes for sale now vs. 135,000 in 2019).
- Washington, Arizona, Colorado: each up about 30% versus 2019.
- Utah: inventory rose approximately 23% versus 2019, reflecting the broader Mountain West trend toward more available supply.
- Northeast exceptions: Connecticut shows a dramatic decline (about -71% vs. 2019), which helps explain continued price strength in many Northeastern markets.
Metro highlights
Metropolitan areas show even wider dispersion. Examples include:
- Austin: inventory up roughly 64% vs. 2019, a shift that has contributed to price declines and a more favorable environment for buyers.
- Denver: up around 48% vs. 2019.
- San Antonio: up around 44%.
- Memphis and Punta Gorda: large increases—Punta Gorda has roughly doubled its available listings since 2019.
- Greater Sacramento: down about 3.2% versus July 2019, an illustration that some West Coast metros remain tighter than national averages.
Local-market signals: MLS offers and competitiveness (Sacramento case study)
One useful metric for market heat is the number of offers received per listing. Data pulled from a regional MLS in Sacramento reveals considerable cooling versus the frenzy of early 2022. Among approximately 891 pending sales reviewed, the vast majority reported only one or two offers. Fewer than ten properties had more than ten offers, a stark contrast to spring 2022 when multiple offers—sometimes dozens—were commonplace and one property reportedly drew 127 offers.
What the offer counts demonstrate is that many markets have moved away from extreme seller leverage. Buyers now frequently find more opportunities, and agents report that showings and tour availability are far less chaotic than during the 2021–2022 surge. For Utah markets—Salt Lake City, Park City, St. George—the local effects depend on neighborhood-level inventory, price band, and mortgage rate sensitivity. Areas that saw the most speculative inflows earlier in the pandemic are often the first to normalize in terms of offer activity.
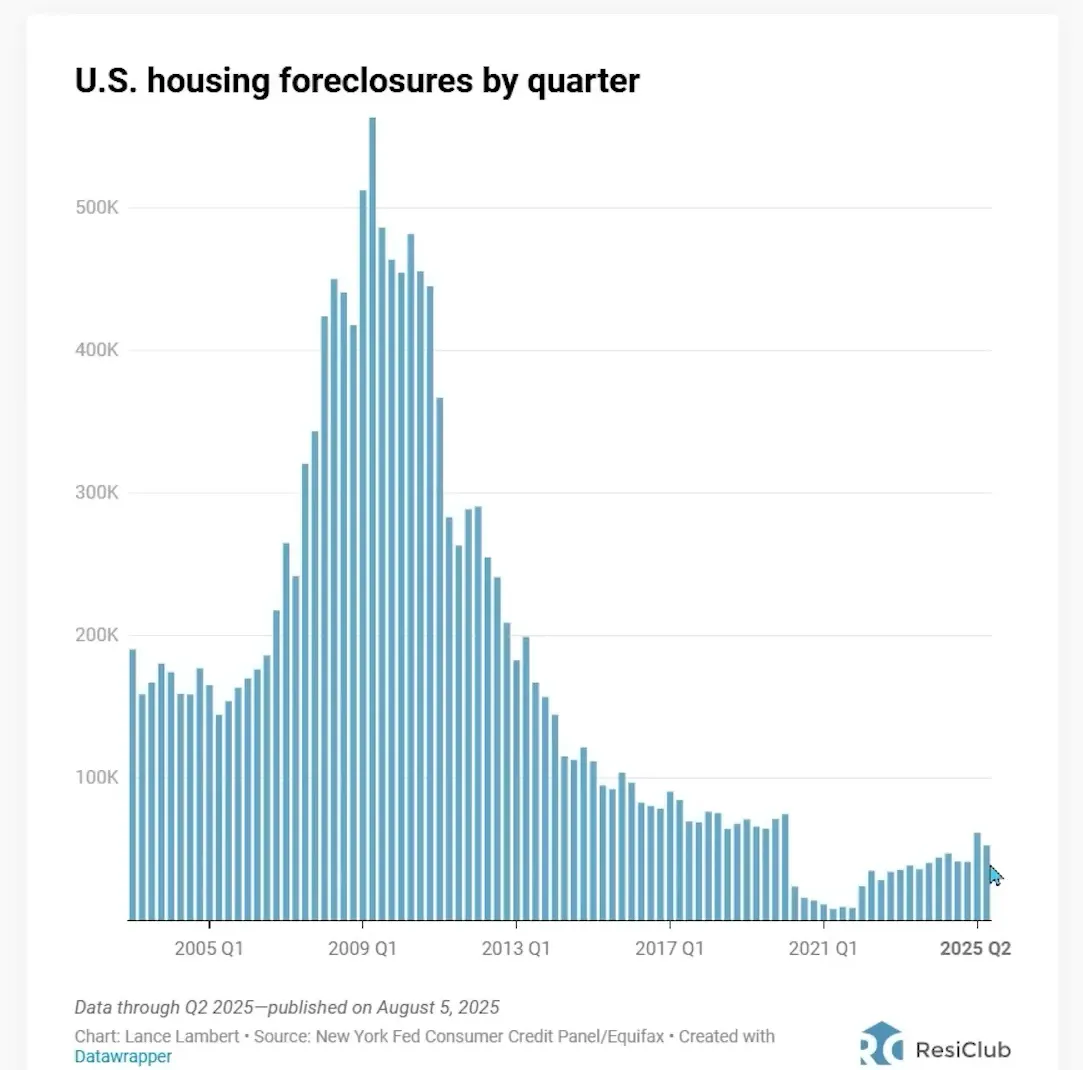
Foreclosures: rising slowly but not spiking like 2008–2009
Foreclosure activity has been creeping upward since pandemic-era protections ended. New York Fed data for Q2 2025 (as presented by Resi Club Analytics) shows foreclosures decreased slightly from Q1 2025 but remain elevated relative to Q2 2024. Even so, current quarterly volumes—on the order of roughly 60,000—are modest compared to the Great Recession era. During the pre-crash run-up, quarterly foreclosure counts reached around 150,000, and at the 2009 peak a single quarter approached roughly 600,000 foreclosures.
The gradual rise in foreclosures reflects several factors: mortgage forbearance and moratoria expiration, the end of certain VA protections, and interest-rate pressure on adjustable-rate or otherwise distressed borrowers. However, the scale and drivers today are materially different from the subprime-driven collapse in 2008–2009. For Utah, foreclosure volumes remain relatively contained, and local lenders and servicers continue to manage workouts, short sales, and modifications that blunt widescale distress.
What Utah buyers, sellers, and investors should consider now
Utah market participants should treat the current environment as one of transition rather than crisis. Inventory increases versus 2019 suggest more choices for buyers—particularly for those priced out during the tightest months—but outcomes will vary by price tier and locale. Sellers in high-demand neighborhoods, or those offering best-in-class condition and pricing, will still command attention. Investors focused on rental yield should monitor foreclosure and supply trends, but broad systemic risk remains limited compared to the Great Recession. Practical considerations include:
- Buyers: take advantage of increased options, but maintain mortgage readiness (pre-approval and clarity on trade-offs between rate, term, and payment). Neighbourhood-level research matters—areas with larger inventory increases typically offer better negotiating leverage.
- Sellers: realistic pricing and strong presentation remain essential. Markets have shifted away from automatic multi-offer scenarios; price and condition will more consistently determine outcomes.
- Investors: evaluate markets for rent growth, vacancy trends, and local supply. Utah cities such as Salt Lake City, St. George, and Park City offer different risk–reward profiles depending on tourism exposure, employment growth, and construction pipelines.
For Utah property searches and local market resources, a centralized portal like can be a useful starting point to identify available listings and local market metrics.
Conclusion
Current housing market dynamics reflect a gradual return toward pre-pandemic balance: inventory is rising, multiple-offer frenzy has largely subsided in many metros, and foreclosures are increasing slowly but are far from 2008–2009 levels. For Utah market participants, the changing landscape brings opportunities for buyers and more nuance for sellers; local, neighborhood-level data should drive decisions. Trusted data sources—Realtor.com, Resi Club Analytics, and New York Fed—provide ongoing signals to monitor, and local market portals such as can help track listings and trends.
Sources
- Resi Club Analytics (inventory and foreclosure compilations)
- Realtor.com (inventory time-series)
- New York Federal Reserve (foreclosure data)
Frequently asked questions
Q: Is the housing market crashing like 2008?
A: No. Although foreclosures and inventory have trended upward, current foreclosure volumes are far below the 2008–2009 peak. Today's mortgage performance is supported by higher lending standards and different credit profiles compared to the subprime-driven crisis. The market is normalizing rather than collapsing.
Q: Will home prices fall further?
A: Price trajectories differ by market and price tier. Nationally, home price growth has softened as inventory rises, and some overheated metros have already seen declines. In Utah, price behavior will depend on local supply/demand, job and income growth, and mortgage rate trends. Balanced markets often see slower appreciation rather than sharp declines.
Q: Are foreclosures spiking?
A: Foreclosures have increased gradually since pandemic moratoria ended and some veteran protections expired, but monthly and quarterly counts remain modest relative to the Great Recession. The increase is noteworthy but not indicative of a systemic collapse.
Q: How should buyers in Utah act now?
A: Buyers should get mortgage-ready, research neighborhood-level inventory and recent sales, and be prepared to move decisively on well-priced homes. Increased inventory provides more opportunities, but desirable properties can still attract multiple offers.
Q: What should sellers in Utah expect?
A: Sellers should expect a more balanced market in many areas. Pricing appropriately, improving curb appeal and staging, and offering transparent disclosures will help achieve favorable outcomes. Luxury and niche segments can behave differently, so local comps are critical.
Keep reading
More from the blog
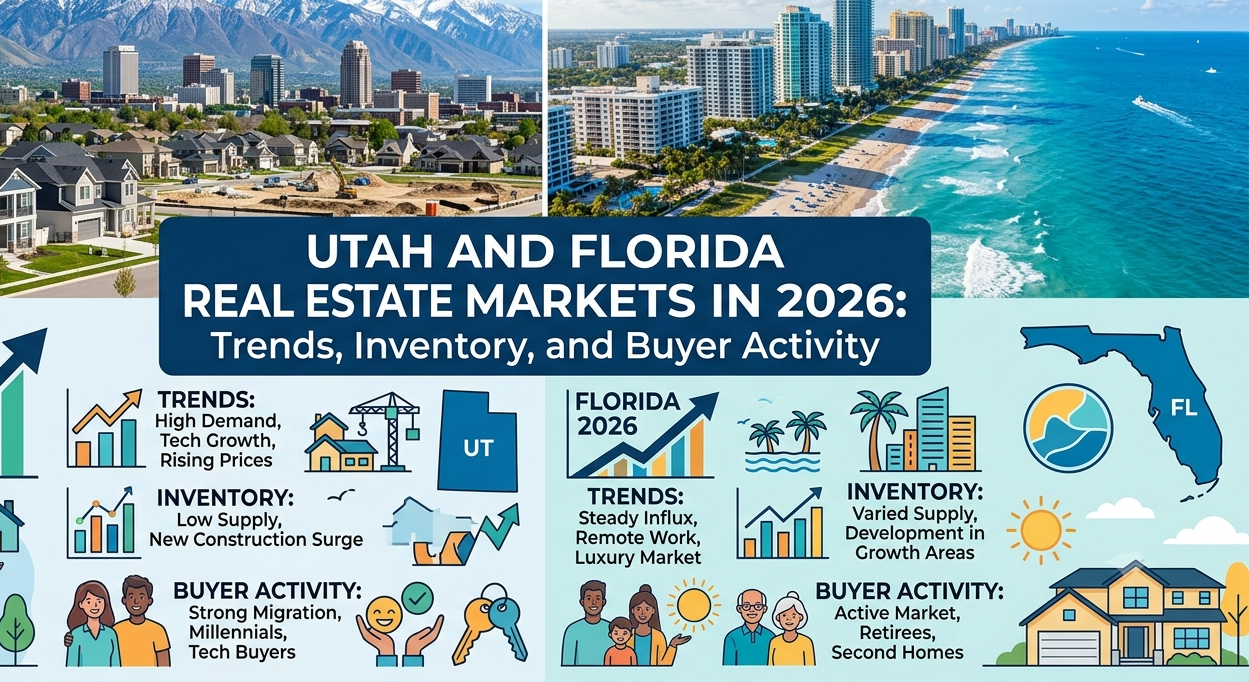
Utah vs. Florida Real Estate Markets in 2026: Key Trends

Design Details Buyers Notice During a Home Tour

How Outsourcing Improves Architectural Project Outcomes