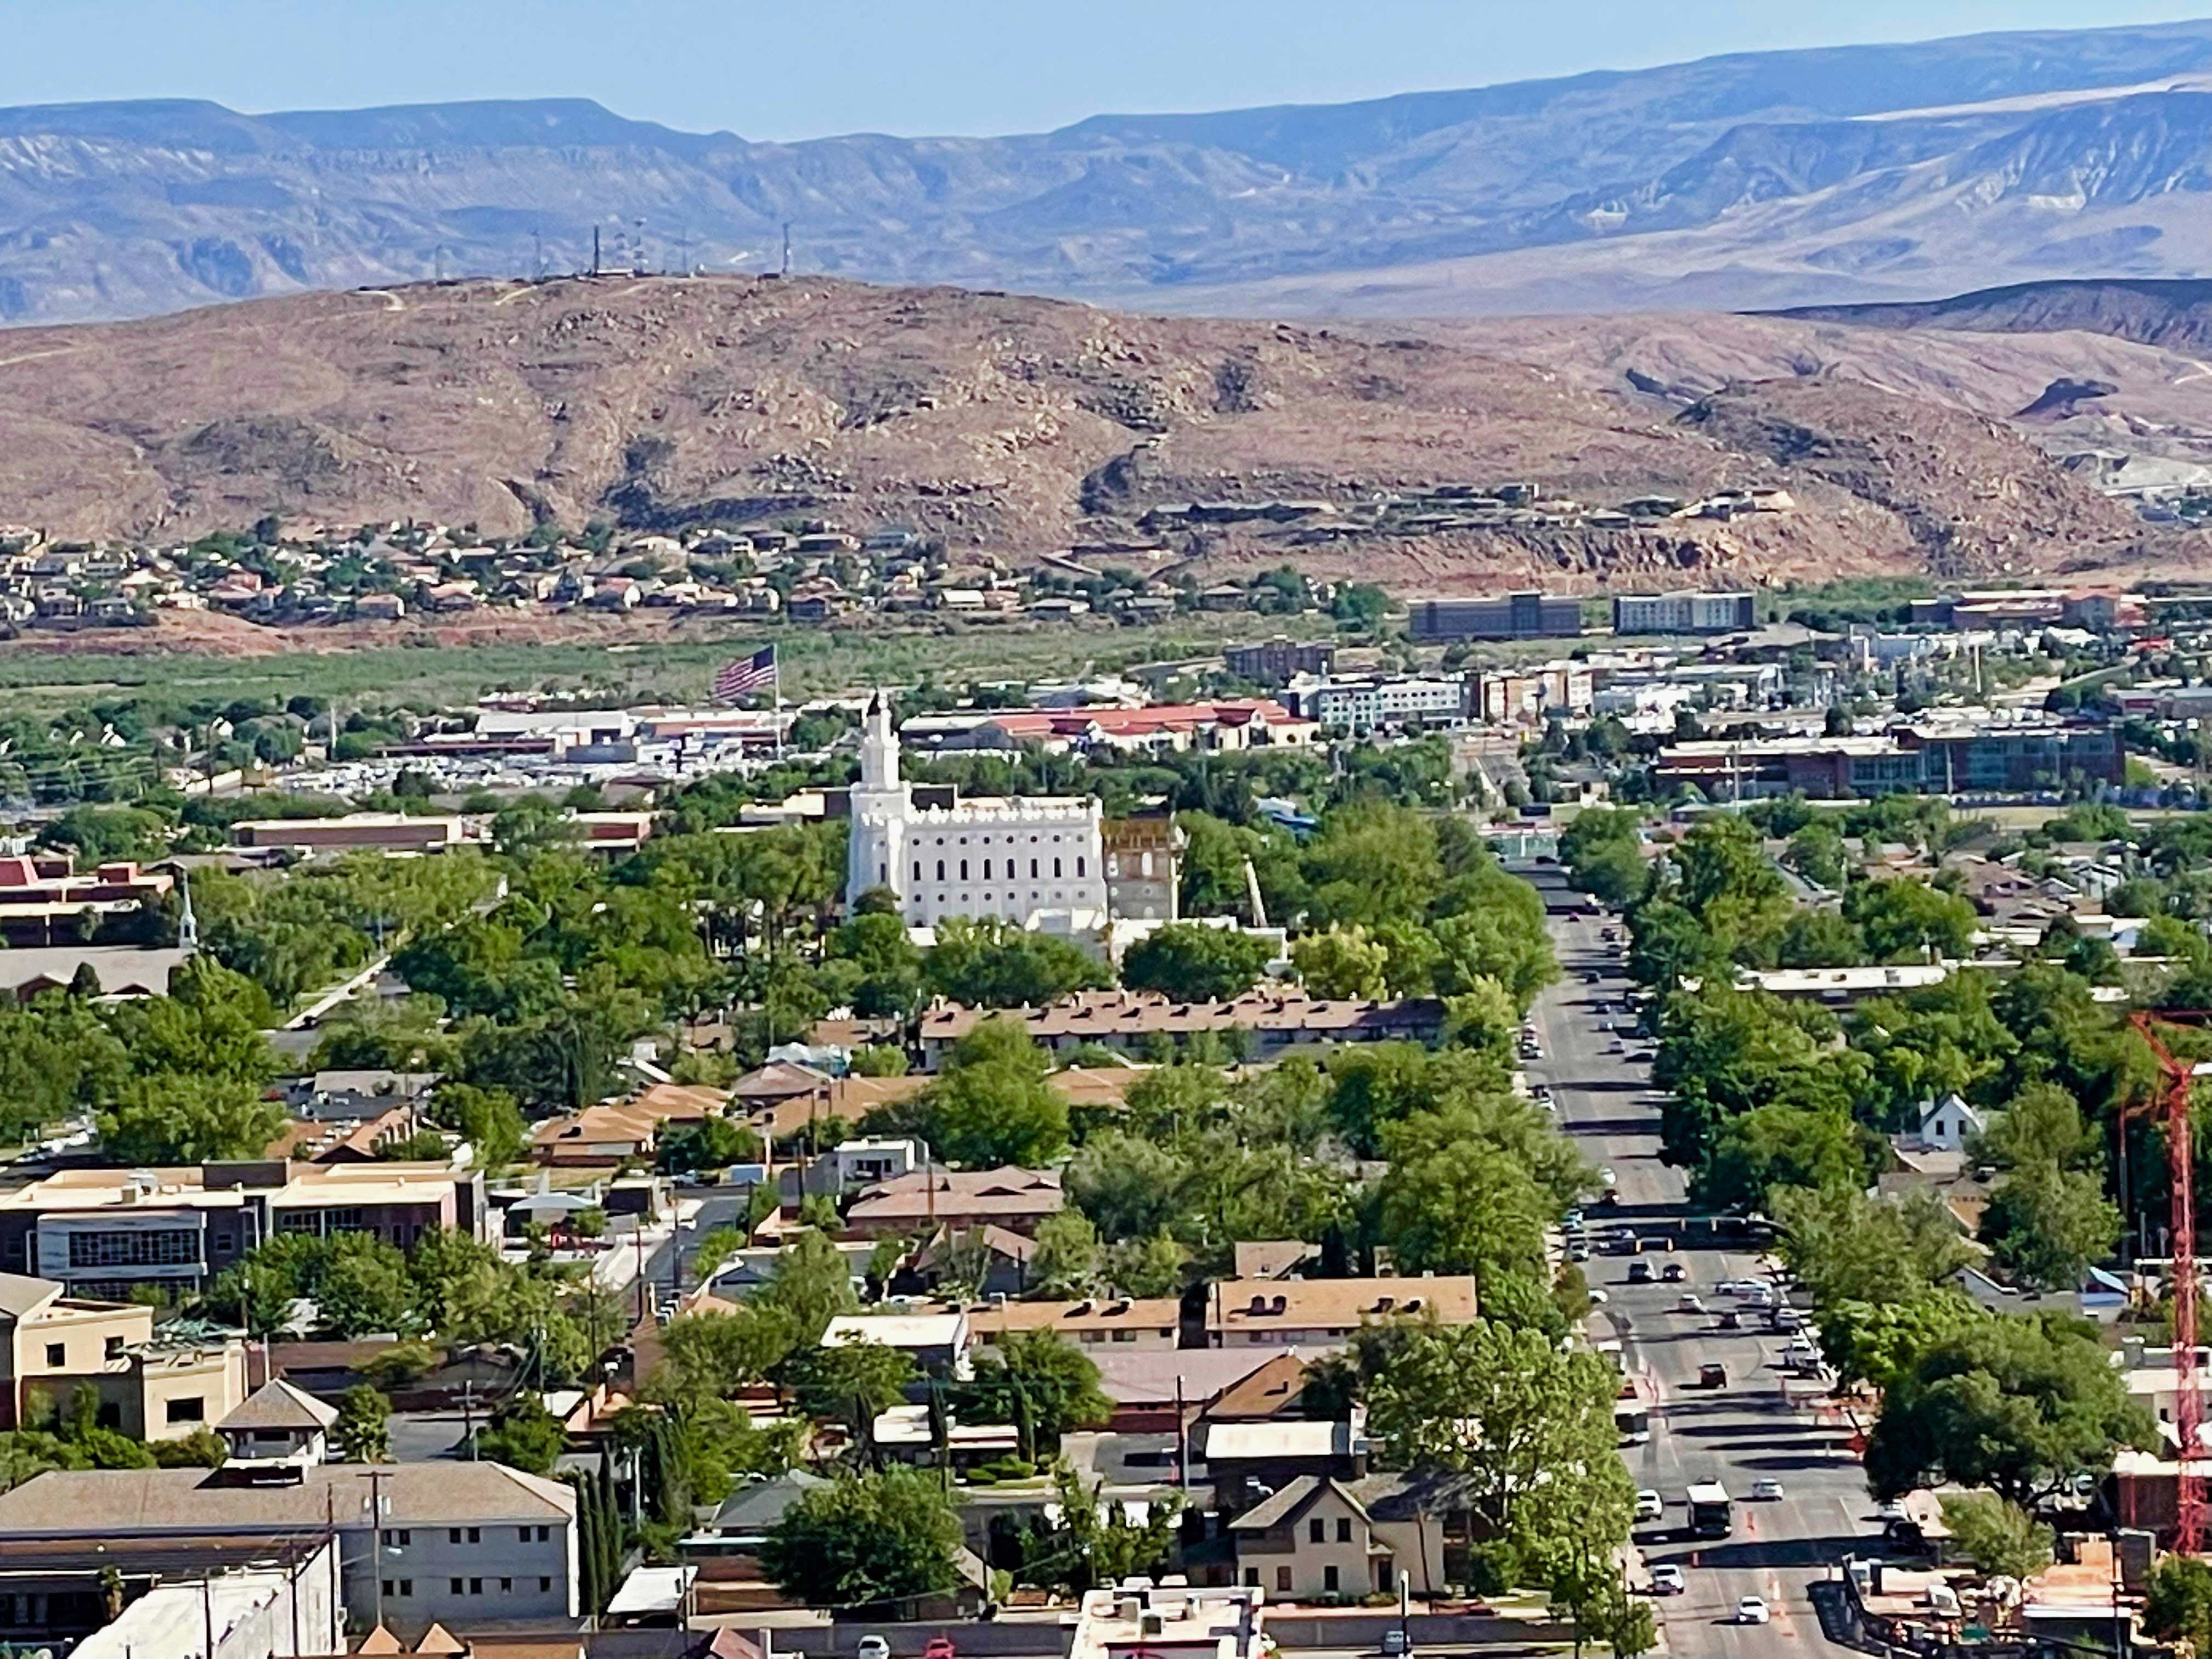
St. George Utah Real Estate Market Report April 2022
The greater St George area home inventory was up slightly in April 2022 this year compared to last year april 2021
St George Utah is in a Super Sellers’ Market
April is a beautiful time of year in St George Utah and the surrounding areas. When spring weather sets in, people tend to get moving! Traditionally, that’s when the housing market picks up.
The greater St George area home inventory was up slightly in April this year compared to last year; but then, so were home prices.
Today we’re comparing market conditions for the month of April 2021 to April 2022. The bottom line? Houses are in high demand and short supply.
Sellers are asking is it still a good time to sell?
Based on data provided by our local multiple listing service, the absorption rate in April 2022 was 131 percent. Let me repeat that in case you didn’t get it: 131 percent. The absorption rate takes into account the number of homes sold divided by the number of homes available. The calculation is a way to determine the availability of inventory compared to demand. A 20 percent absorption rate is considered a sellers’ market.
In April 2021, the absorption rate came in at 77 percent. A moderately high absorption rate (like that 20 percent we just talked about) can give sellers a little boost. An absorption rate like 77 percent or (yikes) 131 percent is not an indication of a healthy market.
With so many buyers and so few homes for sale, the result is painful. Sure, sellers can make some pretty significant equity at a time like this if they can find the right buyers. There is no lack of buyers, but there is a great deal of competition for nearly every home on the market. Many sellers receive multiple offers and they are often more than the original asking price. It’s critical to have a real estate buyer’s representative with a wide sphere of influence and some serious negotiation skills.
Yes, it’s a great time to sell, particularly if you’re moving out of the area to a market where inventory is higher.
Yes, it’s a good time to buy because interest rates will increase at least two more times this year and we don’t see an end to the run on housing in the near future. Interest rates are going up, prices are steadily increasing too so there doesn’t seem to be much benefit to waiting if you want to buy here within the next year.
Supply and demand
So, we’ve made it pretty clear that we’ve got a supply and demand problem in St. George, Hurricane, Ivins, Washington and all the neighboring Washington County communities. You’ve probably already guessed that means people are willing to pay more for a home they really, really, really want or need.
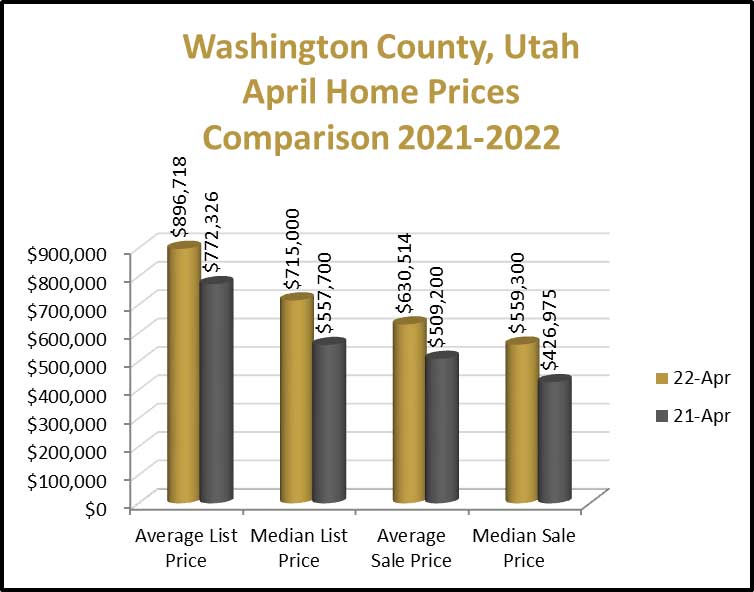
In April 2021 the median home price overall in Washington County was $557,700. That amount increased 28.21 percent in 2022 to $715,000.
Just in case you’re not a statistics guru, the median price means there were exactly as many homes listed above that price as there are below it. It’s right in the middle.
The average home listing price in April 2021 was $772,326 compared to $896,640 in 2022. If you were to take the listing price of all homes and then divide the sum by the number of available homes, you would arrive at the average home price.
I will caution you, that the housing market is a living thing. Homes come on the market, homes go under contract in one month with the sale completion in the next month, etc. It’s interesting to look at the data month by month, but don’t panic because it’s sometimes best to look closely at an extended period of time to get a better picture. Also, one extremely high sale or extremely low sale can skew the numbers.
The median sold price (the amount sellers actually received for their homes) in April 2021 was $426,975. That amount increased by 30.99 percent to $559,300 in the same month in 2022.
The average sold price was $509,200 in April 2021 compared to $630,514 in 2022 (a 23.82 percent increase).
The fact that listing prices were significantly higher than sold prices in April isn’t really of great consequence because, again, we’re looking at one month. Many transactions start in one month (thereby rendering a home under contract and unavailable) and then close in another. For example, by the end of April 2022, there were 452 home sales pending. In April 2021 there were 561 homes under contract (aka pending).
April 2022 actually saw a decrease in the number of homes sold (461) compared to the same month in 2021 (558). Could it be that some buyers are backing off due to higher prices and less availability?
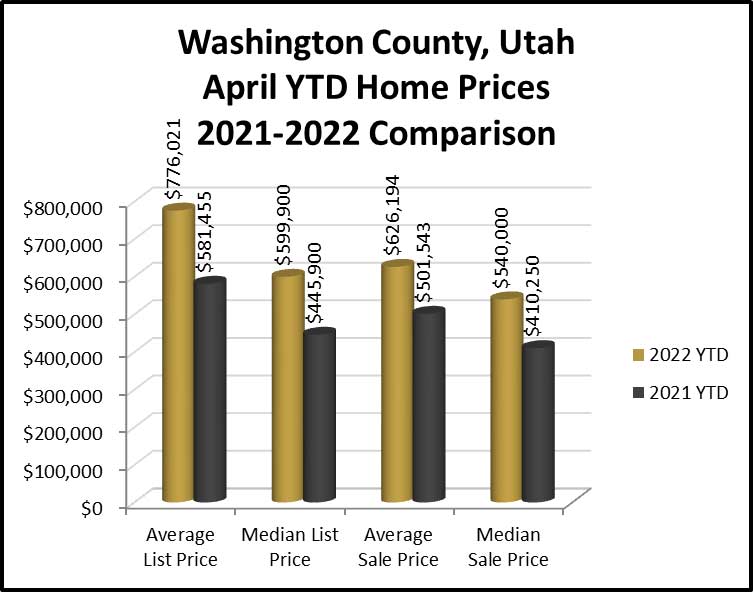
Year to Date figures tell a similar story
From Jan. 1, 2022, to April 30, 2022, 1,782 home sales closed with 452 sales pending. That’s a pretty good decrease from the same time period the year before when 2002 homes sold (an 11 percent decrease in 2022). April 2021 closed out the four-month period with 516 sales pending (12.4 percent more than this year).
Will you still be able to buy a home?
If you are set on buying a home in 2022, there are many things you can do to get ready:
- Get your ducks in a row and get a letter of pre-approval before you go home shopping
- Make sure you have enough money in the bank to cover the earnest money, down payment, closing costs and any other costs associated with buying your home before you make an offer.
- Check your credit score regularly and increase it as much as possible before applying for a loan.
- Be ready to jump when your time has come.
- Lower your debt-to-income ratio as much as possible.
If you need assistance with buying or selling a home, call me. If you’re not ready, I’ll walk you through the process of getting ready and together we’ll make your real estate dream come true.
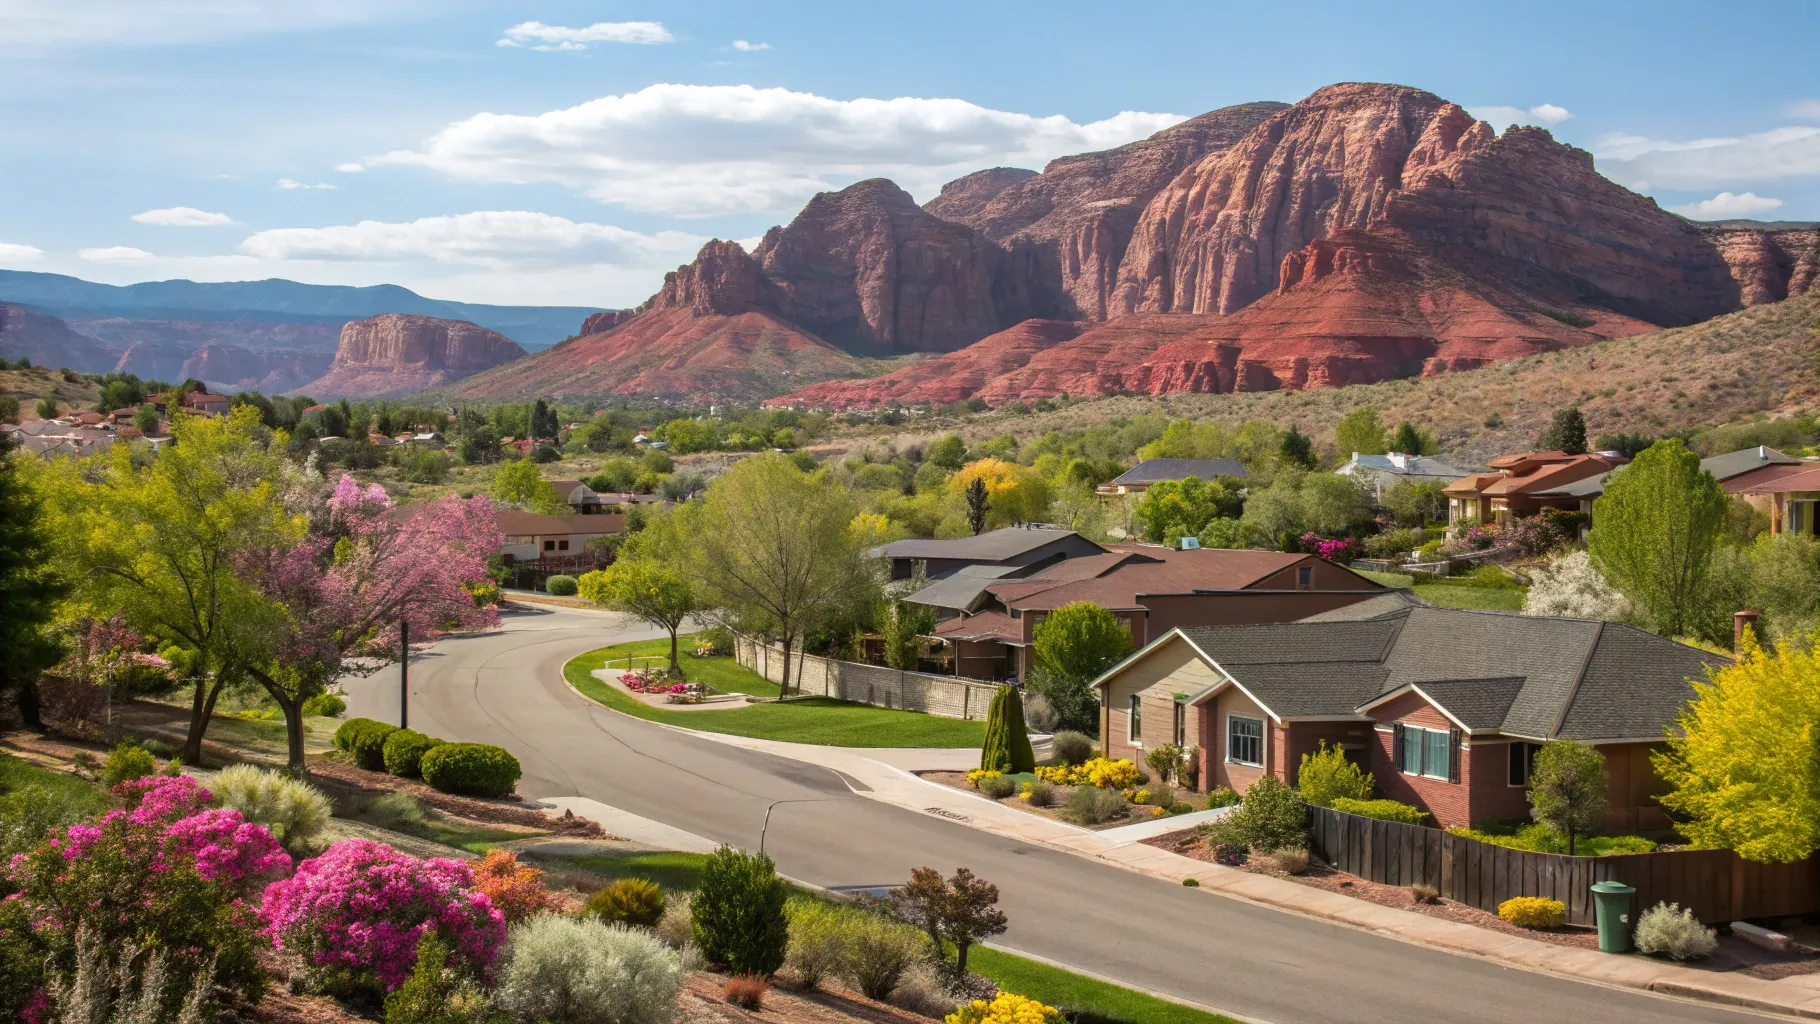
St George, Utah housing market
A quick read on what homes are doing in St George right now — pulled live from the MLS.
Keep reading
More from the blog

Southern Utah Real Estate Snapshot — August 2025: Cedar City & St. George

July 2025 Housing Market Update for Southern Utah: Cedar City and St. George Insights
St. George, Utah Real Estate Market Update: Insights for Buyers and Sellers in February 2025