Data through August 30, 2025, shows a shifting but still seller-leaning housing market across Southern Utah. This update compares year-over-year August activity for Cedar City and St. George to reveal inventory trends, days on market, absorption rates, price movement, and the factors most likely to influence the local market moving into 2026. National indicators and mortgage rate forecasts are included to help buyers, sellers, and investors make informed decisions.
Quick Market Snapshot: August 2025 (data through 8/30/25)
- Cedar City — Active listings: 351; New in August: 94; Pending: 86; Closed in August: 61. Median days on market: 51 days; Average days on market: 62 days. Months supply (absorption): 5.31 months. Median sales price (August year-over-year): approx. $386,000.
- St. George — Active listings: 725; New in August: 260; Pending: 173; Closed in August: 161. Median days on market: 55 days; Average days on market: 73 days. Months supply (absorption): 4.25 months. Median sales price (August year-over-year): approx. $532,000.
Cedar City: Inventory and Sales Activity
Cedar City's inventory climbed to 351 active listings in August 2025, the highest level recorded over the last 10 years for the month of August. New listings in August hovered around historical norms with 94 homes coming to market, a pattern consistent with the decade-long trend of roughly 100 August listings. Pending contracts (86) are up compared to the last three years, but closed sales (61) continue a multi-year downward trend that mirrors the 2016 level. Median and average days on market (51 and 62 days respectively) have nudged higher since the pandemic-driven low-period but remain comparable to earlier market cycles.
St. George: Larger Market, Similar Patterns
St. George shows the same broad pattern of rising inventory: 725 active listings in August 2025, a decade-high for the month. New, pending, and closed metrics (260, 173, and 161 respectively) have tracked closely for the past several years, suggesting listings are accumulating while the pace of closings holds relatively steady. Days on market increased markedly—median days rose to 55 and the average to 73—reflecting a market where homes are taking longer to sell than in the heat of the low-rate period.
Days on Market: Median vs. Average
Both cities are showing longer selling timelines compared with the pandemic and immediate post-pandemic years. Median days on market deliver a clearer view of the “typical” listing experience (Cedar City: 51 days; St. George: 55 days). Average days, which can be skewed by long-staying outliers, are 62 in Cedar City and 73 in St. George. When median and average diverge, sellers should be aware that a subset of listings is lingering substantially longer, potentially due to price, condition, or marketing.
Absorption Rate and Market Balance
Absorption rate (months supply) is a key indicator of market balance. August 2025 shows Cedar City at roughly 5.31 months supply and St. George at roughly 4.25 months supply. Conventional interpretation places less than six months' supply in seller-market territory (prices tend to appreciate), six to seven months as neutral (prices move with inflation), and above seven months as a buyer market (downward price pressure). Despite inventory increases, both Southern Utah markets remain technically seller markets, which helps explain why prices have stabilized or rebounded from recent dips.
Explore Utah Real Estate

83 W 850 S, Centerville, UT
$815,000
Bedrooms: 5 Bathrooms: 3 Square feet: 3,999 sqft
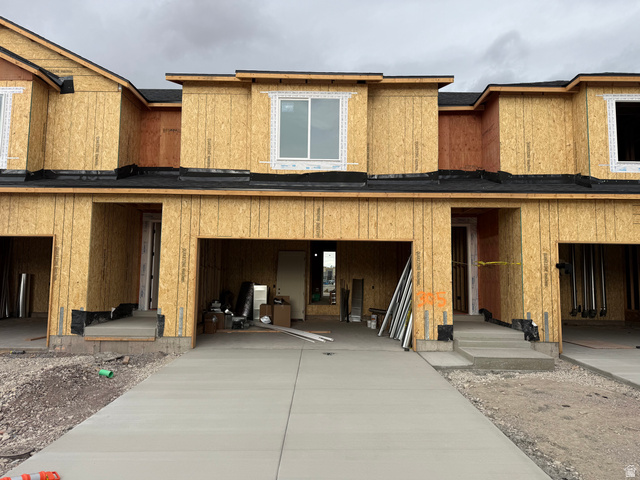
653 E RYEGRASS DR #305, Eagle Mountain, UT
$387,900
Bedrooms: 3 Bathrooms: 3 Square feet: 1,985 sqft
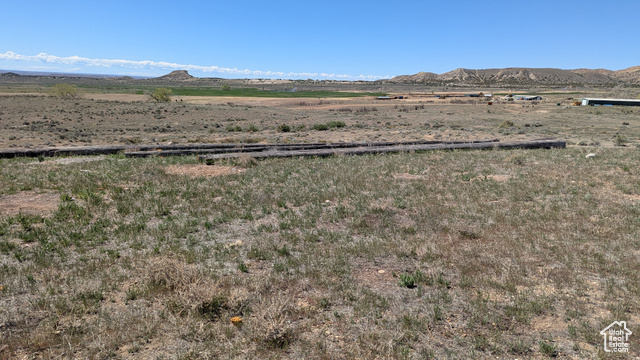
2098 E GOOSE RANCH RD, Vernal, UT
$103,000
Square feet: 274,864 sqft
Home Price Trends: Where Prices Have Moved
Cedar City median prices declined from roughly $355,000 in 2022 to about $340,000 in 2023–2024, then rose to approximately $386,000 by August 2025. The average price has trended upward over the decade, indicating long-term appreciation despite short-term corrections.
St. George experienced a larger median-price dip from about $554,000 in 2022 to lower levels in 2023, then settled near $532,000 by August 2025. A similar pattern appears in the average price, which fell and has since resumed an upward trajectory. These shifts correlate strongly to changing mortgage-cost dynamics and buyer pause during rate increases.
Supply, New Construction, and Long-Term Stability
Local markets have seen increased building activity in response to roughly 15-plus years of underbuilding. Additional supply from new construction helps relieve long-term shortage pressures that contributed to rapid price gains earlier in the decade. While some perceive new development as "overbuilding," construction can stabilize prices by increasing options for buyers and preventing runaway appreciation tied to constrained supply. In short, responsible new development provides a safety valve that supports healthier, more sustainable markets.
More Properties You Might Like
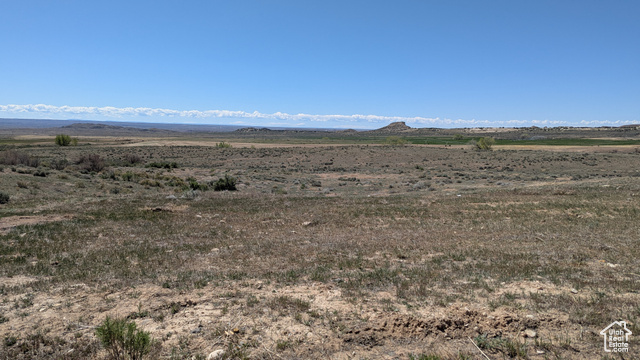
2148 E GOOSE RANCH RD, Vernal, UT
$116,000
Square feet: 309,276 sqft

6668 S 3200 W, Spanish Fork, UT
$2,199,999
Bedrooms: 3 Bathrooms: 3 Square feet: 2,560 sqft

1500 FISH CREEK RD, Bancroft, ID
$1,100,000
Bedrooms: 6 Bathrooms: 4 Square feet: 3,767 sqft
Is a 2008-Style Crash Likely?
Current inventory levels in August 2025 remain far below 2008-era levels. In August 2008, local monthly supply topped roughly 17 months—nearly a year and a half of inventory—creating strong downward pressure. Present absorption rates of about 4–5 months are nowhere near the 2008 surplus, making a comparable nationwide crash unlikely based solely on inventory. Additionally, several major forecasting bodies project housing activity to stabilize and recover into 2026, which undercuts the idea of an imminent steep downturn in these markets.
National Demand, Sales Forecasts, and Buyer Behavior
Nationally, closed sales topped 4 million in 2024 and were projected to edge slightly higher for 2025, with some forecasts pointing toward nearly 4.5 million closings in 2026. Buyer demand indicators through mid-2025 showed increased activity compared with the same period in 2024—an encouraging signal that demand may continue to strengthen if mortgage costs decline. Local Southern Utah markets will respond quickly if rates move downward, because many buyers who have delayed purchasing are actively monitoring any rate reductions.
Mortgage Rates: The Primary Market Lever
Mortgage interest rates have been relatively stable in recent months, lingering between about 6.5% and 7%. Major forecasters have suggested a gradual easing through late 2026, with forecasts clustering between roughly 6.0% and 6.6% by Q4 2026. Even a quarter-point to half-point decline can make a meaningful difference in monthly payments on a typical mortgage balance and often brings sidelined buyers back to the market. For example, small rate changes materially affect monthly payments on a $400,000 loan, which in turn can create competitive conditions and multiple-offer scenarios when rates dip.
Practical Guidance: Buying, Selling, and Investing in Southern Utah
For Buyers
- Assess personal finances and long-term plans rather than attempting to perfectly time the market—timing rarely works out as expected.
- Get pre-approved and stay ready; many buyers re-enter quickly when rates soften.
- Consider local inventory levels: while supply is higher than recent years, both markets remain below the six-month threshold that signals a buyer market.
For Sellers
- Price competitively; accurate comparables are essential. Utah’s non-disclosure status means public sites like Zillow and Redfin rely on estimates rather than complete sale-price data.
- Prepare the home to show better than competing listings—presentation and marketing remain decisive in attracting offers.
- Partner with a local professional who can pull reliable comparable sales and advise on staging, timing, and pricing strategy.
For Investors
- Monitor inventory, days on market, and absorption trends—these metrics indicate relative strength and rental demand potential.
- Factor in new-construction supply: increased inventory can moderate appreciation but also signal long-term community growth and infrastructure investment.
Action Steps Checklist
- Review current mortgage pre-approval or financing options to understand true purchasing power.
- Compare active listings and recent closed sales in the target neighborhood for realistic pricing expectations.
- Decide on must-have features vs. negotiable items to allow flexibility in competitive situations.
- For sellers, complete a market-ready checklist: declutter, complete minor repairs, set a data-driven list price, and list with a local market expert.
Conclusion
August 2025 data indicates growing inventory in Cedar City and St. George, lengthening selling times, and absorption rates that still favor sellers. Home prices show recovery from earlier dips, while buyer demand and national sales forecasts suggest gradual improvement into 2026 if mortgage rates ease. Buyers, sellers, and investors should remain focused on local data, financing readiness, and accurate comparables to navigate a market that rewards preparation and realistic expectations.
Frequently Asked Questions
Is Cedar City or St. George a buyer's market right now?
Neither city is currently a buyer's market by conventional absorption-rate standards. Cedar City has about a 5.31 months supply and St. George about 4.25 months—both figures fall under the six-month threshold that typically defines a seller's market. That said, homes are taking longer to sell than during the low-rate boom, so buyers may find more negotiating space than in a hot market.
Should buyers wait for mortgage rates to fall?
Decisions should hinge on personal financial readiness and housing needs rather than waiting for an ideal rate environment. Even small rate drops tend to attract many buyers simultaneously, increasing competition. Buyers who are financially prepared and have clear goals often benefit from moving forward rather than attempting precise timing.
Is new construction harming resale values?
New construction increases supply, which can moderate rapid price appreciation and provide more options for buyers. Responsible development after prolonged underbuilding is typically stabilizing for a market and may prevent speculative spikes. Resale values depend on location, product type, and overall demand—careful due diligence on comparable neighborhoods is essential.
How should sellers price a home in a non-disclosure state?
Sellers should rely on local, up-to-date comparable sales pulled by a market-savvy professional. Public estimate tools can be a starting point, but they often lack full transaction visibility in Utah. Accurate pricing, paired with strong presentation, produces the best chance for a timely sale at favorable terms.
Resources and Next Steps
For broader Utah market tools and up-to-date property listings, visit https://bestutahrealestate.com. Use local metrics—active listings, pending sales, days on market, and months supply—to compare neighborhoods and timing decisions. When evaluating strategy, prioritize verified comparables and mortgage scenarios that reflect current rate forecasts.


