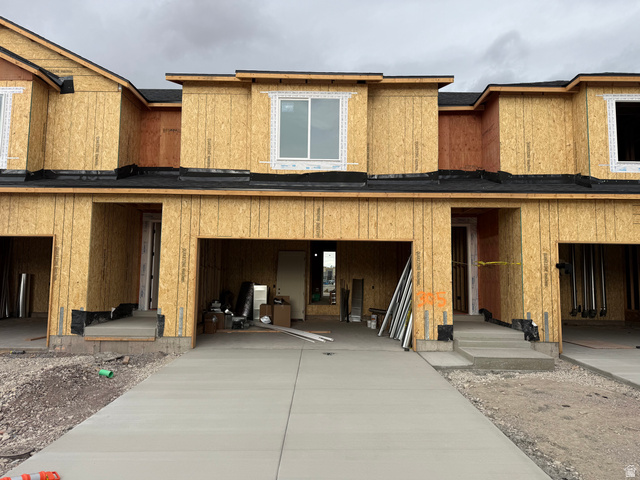
The U.S. housing market is undergoing significant shifts as housing inventory reaches a five-year high, hitting levels not seen since the winter of 2019. Despite this surge in available homes, sales have declined by 2.5% compared to last year, signaling a weakening demand nationwide. This trend is reflected in home prices, with 70% of the 50 largest metro areas now experiencing year-over-year price declines. These nationwide trends provide important context for Utah's real estate market, where local dynamics continue to shape opportunities for buyers, sellers, and investors.
National Housing Inventory Trends: What the Numbers Reveal
Housing inventory in the U.S. has increased steadily for 19 consecutive months, with active listings rising 31.5% in May 2025 compared to May 2024. This growth builds upon April's 30.6% increase and marks the first time since early 2019 that the total number of homes for sale topped one million nationwide. While this is a significant rise, inventory still remains 14.4% below pre-pandemic levels observed between 2017 and 2019.
Among the nation's 200 largest metro areas, 75 have housing supplies at or above pre-pandemic 2019 levels. However, this growth is uneven, with some markets seeing dramatic increases while others continue to experience shortages of available homes.
Key Metro Areas Showing Inventory Growth
- Denver: Inventory up 65% since May 2019
- Austin: Inventory up 71%
- San Antonio: Inventory up 44%
- Dallas: Inventory up 30.5%
- Florida's Lakeland Winter Haven: Inventory up nearly 80%
Conversely, some regions, especially in the Northeast and Midwest such as Hartford, Connecticut, and Virginia Beach, Virginia, have seen inventory declines of over 50%, largely due to limited land availability and less new home construction.
Understanding the Disconnect: Rising Inventory vs. Declining Sales
Despite more homes being available, buyer activity remains subdued. Pending home sales, which represent homes under contract but not yet closed, have decreased 2.5% year-over-year, mirroring the trend seen in April 2025. This persistent decline in transactions since mid-2021 has not yet caused a dramatic drop in home prices nationally, but it reflects a cooling demand environment.
Explore Utah Real Estate

83 W 850 S, Centerville, UT
$815,000
Bedrooms: 5 Bathrooms: 3 Square feet: 3,999 sqft

653 E RYEGRASS DR #305, Eagle Mountain, UT
$387,900
Bedrooms: 3 Bathrooms: 3 Square feet: 1,985 sqft

2031 N LAVA ROCK CIR #107, St George, UT
$4,185,000
Bedrooms: 4 Bathrooms: 5 Square feet: 5,404 sqft
The "bathtub analogy" helps illustrate this phenomenon: housing inventory is the water level in the tub, new listings are the water flowing in, and home sales are the drain. Currently, the drain is clogged—sales are low—while new listings have increased modestly but not sharply. This imbalance causes the inventory level to rise, but the flow of new listings is not accelerating enough to flood the market.
New Listings: A Closer Look
Newly listed homes increased 7.2% in May 2025 compared to May 2024, a slowdown from April's 9.2% increase. Although new listings are higher than in previous years, they still lag behind pre-pandemic figures. In many markets, such as Sacramento, new listings typically peak in May to kick off the home buying season. However, this year, new listings in Sacramento decreased slightly by 1.4% month-over-month, illustrating local market variations.
Price Reductions and Their Growing Prevalence
Price reductions are becoming more common as sellers adjust to the cooling market. In May 2025, 19.1% of home listings experienced price cuts, up 2.4 percentage points from last year. This means nearly two out of every ten homes on the market had reduced asking prices—the highest May share since Realtor.com began tracking data in 2016.
While this increase in price reductions is notable, it is less abrupt than the sharp rise seen during the 2022 market correction, when price drops doubled from around 6% to 11% within months.
Regional Variations in Price and Inventory
Among the 50 largest metro areas, 35 now have lower home prices than a year ago, reflecting the impact of rising inventory and subdued demand. For example:
- Austin, Texas: Prices down 6.3%, with 69% more homes for sale compared to pre-pandemic levels
- Denver, Colorado: Prices down 5.8%, with inventory doubled since 2017-2019 averages
- Sacramento, California: Prices down 3.6%, with a modest 4.9% increase in inventory
- Hartford, Connecticut: Prices up 3.2%, inventory down 77.7%
- Virginia Beach, Virginia: Prices up 5.4%, inventory down 54%
These contrasts highlight the importance of local market conditions, including land availability, new home construction, and regional economic factors.
More Properties You Might Like

2098 E GOOSE RANCH RD, Vernal, UT
$103,000
Square feet: 274,864 sqft

2148 E GOOSE RANCH RD, Vernal, UT
$116,000
Square feet: 309,276 sqft

6668 S 3200 W, Spanish Fork, UT
$2,074,000
Bedrooms: 3 Bathrooms: 3 Square feet: 2,560 sqft
Implications for Utah's Real Estate Market
Utah's real estate landscape shares some of these national trends but also presents unique opportunities and challenges. Major Utah cities like Salt Lake City and its suburbs continue to experience strong demand, although inventory levels are gradually increasing, particularly in fast-growing areas such as Lehi, South Jordan, and American Fork. These areas remain attractive due to their family-friendly communities, access to outdoor recreation, and expanding job markets.
As inventory rises, buyers in Utah may find more choices and potential for negotiation, especially in markets where price reductions are becoming more common. Sellers, on the other hand, should be prepared for a more balanced market and may need to adjust pricing strategies accordingly.
For those considering investment or relocation in Utah, understanding how supply and demand dynamics are evolving is essential. Consulting resources such as Salt Lake City real estate listings can provide insight into current market conditions and available properties.
Conclusion
The U.S. housing market in June 2025 is characterized by an unprecedented rise in housing inventory coupled with weakened buyer demand and increasing price reductions. While this has led to price declines in many large metro areas, local market conditions vary widely. For Utah, these trends translate into a gradually shifting landscape where buyers gain more options and sellers face a more competitive environment.
Staying informed about inventory levels, sales activity, and pricing trends is critical for anyone involved in the Utah real estate market. For further information on Utah's housing trends and to explore current listings, visit bestutahrealestate.com.
Frequently Asked Questions
Why is housing inventory rising but sales are falling?
Inventory is increasing due to a combination of more homes being listed and slower sales activity. Buyer demand has weakened, which means fewer homes are selling even though more are available.
How does rising inventory affect home prices?
Rising inventory usually puts downward pressure on home prices because buyers have more options and sellers may need to reduce prices to attract offers, as seen by the increase in price reductions nationwide.
What are the implications for buyers in Utah?
Buyers in Utah can expect more choices and potentially better negotiating power as inventory grows. However, market conditions differ locally, so it's important to monitor specific city trends.
Are price reductions common in Utah's housing market?
While price reductions are increasing nationally, their prevalence varies by market. In competitive Utah areas, sellers may start to adjust prices more frequently to attract buyers, reflecting broader market shifts.
Where can I find reliable real estate listings for Utah?
Reliable listings and market information can be found at
bestutahrealestate.com, which offers updated property data across Northern and Southern Utah.


