The Average 30 or fixed rate mortgage rates just increased to a eight-month high to 7.22% in July 9th of 2023. For someone looking to buy an average price home today compared to 12 months ago, it's going to cost them hundreds more per month in their average monthly housing payment due to this giant increase in rates. Meanwhile, housing affordability is now the worst on record because home prices surprisingly are still on the rise this year despite these high rates.
Average rates for people with great credit, by the way, according to the Morris News Daily is at 7.22%, a giant increase of 14 basis points compared to July 5th 2023. Also, 7.22% is not too much far off a 12-month-high. The 12-month high was at 7.37%. Also for a jumbo loan is just under 7% and also for FHA and a 30-year fixed VA loan is also around 7% as well. So one question of course is why did rates increase by 14 basis points on Thursday? And the reason for this very briefly here is this right here. Of course, as you guys all know, average rates for mortgages is loosely tied to the yield on the 10-year US Treasury note.
And that actually increased over 4% on Thursday due to a stronger than expected employment report that was released here by the ADP. Rates have already began rising last week following signals that the Fed is going to start increasing rates once again after a pause in June. Also, in remarks to Congress after its June Fed meeting, Fed chair Jerome Powell said the central bank has "a long way to go" to bring inflation back to the 2% goal. The next interest rate decision is on July 26 here. In regards to this stronger than expected employment report, this is really a blowout report here because according to the ADP, their report here showed that in the private sector, jobs jumped by 497,000 for the month of June. This beat expectations by a long shot because the expectation was for 220,000 and it came at 497,000, which is also much greater than May's gains of 267,000.
Because of this much stronger report here regarding the jobs market, this is why the 10-year US treasury note surged by just over eight basis points to over 4% right now. By the way, the last time that the 10-year was at 4% or higher was way back on March 1st of 2023. So because the yield on that increased greatly, that's why we had a giant surge in rates today, which again is July 6th 2023. On Thursday, average rates at 7.22%. In 2022 it was at 5.65%. That's an increase of over 1.5 percentage points over the past 12 months. So here's the true impacts regarding these rising rates for home buyers right now. This is a common example that I share on the channel pretty frequently here. So because rates went from 5.65%, for someone looking to buy a average price home today, which the median sale price nationwide is around $400,000 at the time of filming this video, putting 5% down your housing payment one year ago, based on rates one year ago, was just under $2,200 per month.
Now, fast-forward to today, average rates at 7.22%. Your new housing payment is actually just under $2,600 per month. That's an increase of $400 more per month to buy an average price home today compared to 12 months ago. And that's number one. Number two is that because rates have increased by about 1.5 percentage points over the last 12 months, you're going to pay a lot more in interest owed or interest paid over the life of that loan. So over a 30-year loan here, you're going to pay approximately $140,000 more in interest paid over the life of the loan because going back 12 months ago, again for buying a $400,000 house, your interest paid through July 2053, a 30-year loan is just under $410,000. Now because rates have increased to 7.22%, your interest paid over the life of that loan is now $550,435. An increase of around $140,000 more in interest paid. On top of that because rates have increased to 7.22%, this is an eight-month-high because the last time rates were this high was way back on November 9th last year when rates were also at 7.22%.
Explore Utah Real Estate

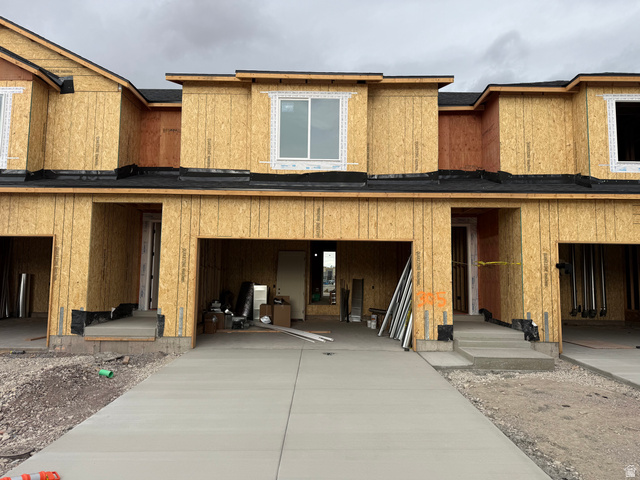
653 E RYEGRASS DR #305, Eagle Mountain, UT
$387,900
Bedrooms: 3 Bathrooms: 3 Square feet: 1,985 sqft

83 W 850 S, Centerville, UT
$815,000
Bedrooms: 5 Bathrooms: 3 Square feet: 3,999 sqft

6668 S 3200 W, Spanish Fork, UT
$2,199,999
Bedrooms: 3 Bathrooms: 3 Square feet: 2,560 sqft
Now, here's something very important to know as well, because average monthly housing payments according to the MBA, just reached an all-time record high. In other words, housing affordability is a worst on record according to data from the MBA here. It says here that application payments or mortgage application payments, these are housing payments based on applications for home loans, people submitting applications for home loans looking at those payments. That increased by 2.5% in May, the average monthly housing payment based on those payments or those applications was $2,165. And according to the MBA, home buyer affordability eroded further in May as perspective buyers continued to grapple with high interest rates and of course low housing affordability for existing houses.
While supply remains low, we do expect that inventory will pick up in the near term, which will provide more opportunities for borrowers to buy a house. I would say that's really due to two main reasons, and that's seasonality because housing inventory tends to peak in the summer months each and every year during normal housing market. That's number one. Also, number two is decreasing demand for home buyers as well, because when we have a decrease in home buying demand, it takes longer for houses to sell and that theoretically increases the number of houses for sale or increases housing inventory because there's less contracts being signed between buyers and sellers. But going back to housing affordability, their purchase applications payment index, or their PAPI, again that increased by 2.5%. An increase in this index means that housing affordability is actually getting worse here.
And it says right here, this increase is indicative of declining borrower affordability conditions, which of course means that your mortgage payment to income ratio is higher due to increasing application loan amounts, rising mortgage rates or a decrease of earnings. And as you can see by this chart right here, which goes back to July of 2009, their index, which of course is a measure of housing affordability again, when an increase in their index means that housing affordability is actually getting worse. As you can see here for the month of May, it reached an all time record high well above pre-pandemic levels when their index was actually much less than is today. Now, here's something we also know as well. This was reported on Wednesday. According to the MBA here, they reported that applications for home loans actually decreased by 4.4% compared to the previous week.
However, what I'm more focused on is this right here. The seasonally adjusted Purchase Index, which is a measure of the amount of home loans to buy houses, that decreased by 5% compared to the previous week. It was also down by 22% from one year ago. According to Joel Kahn, who's the MBA's Vice President and Deputy Chief Economist, he stated the following: "Applications fell to the lowest level in a month last week as rates for most loan types increase." Which makes sense, right? Applications decrease when rates increase. "Purchase applications decrease for the first time in a month, as home buyers remain sensitive to rate changes. Rates are still over a percentage point higher compared to one year ago, and housing affordability is still a challenge in many parts of the country."
Here's another trend we're seeing right now as well. Here is the National Association Realtors Central Lock Home Showings Report. This is a measure of real estate showings across the United States here. So on a national level, home showings were down 3% compared to May of 2022, one year ago. Home showings decrease in each of the four major regions except for one of them. So for example, home showings. This may compare to last May in the Northeast fell whopping 15%, the Midwest fell by 10%, the West decreased by 4%. In contrast though, in the South home showings increased by 2%. Before we look at more recent trends regarding home showings across North America, here is showingtime.com. So for the week ended July 4th, home showings this year decreased by 5.6%, whereas last year at this time it decreased by 21%. Compare that to 2021 home showings actually increased by 2.5%. One thing you guys should be aware of though, if you guys haven't followed the channel yet, and this is your first video, for example, this report right here covers home showings compared to the first week each year.
More Properties You Might Like

1500 FISH CREEK RD, Bancroft, ID
$1,100,000
Bedrooms: 6 Bathrooms: 4 Square feet: 3,767 sqft

86 S 950 E, Hyde Park, UT
$774,900
Bedrooms: 6 Bathrooms: 4 Square feet: 3,544 sqft

LOOKING GLASS RD, La Sal, UT
$998,100
Bedrooms: 3 Bathrooms: 1 Square feet: 792 sqft
So for this year, home showings are down by 5.6% compared the first week this year, and also compared to last year, they're down by 21% compared to the first week of 2022. And this, by the way, has been a common pattern we've been seeing here because home showings in 2021 were much higher compared to 2022, as well as 2023. Let me just exclude 2021. Also, home showings compared to last year were actually better than last year, ever since the middle of April this year.
This is going to be very, very interesting if rates stay at these very high levels, historically speaking over the past several years here, because if we have a decrease in home buying demand due to seasonality, you couple that with rates that haven't been this high in about eight months, that's a recipe for healthy market to decrease further than it would have during this time of year.
Related Articles:


