Zillow: Decline in Home Values is Coming
In a significant shift, Zillow has recently updated its housing market forecast for 2025, projecting a decline in home values across the United States.
In a significant shift, Zillow has recently updated its housing market forecast for 2025, projecting a decline in home values across the United States. This development raises questions about the stability of the housing market and what it means for potential buyers and sellers. In this article, we will delve into Zillow's predictions, compare them to past market trends, and explore key metrics that investors and homeowners should monitor to navigate this evolving landscape.
Understanding Zillow's Updated Forecast
According to Zillow, the company expects home values to drop by an average of 1.9% this year. This marks a notable revision from their previous forecast, which anticipated a modest increase of 0.6%. The change is attributed to a combination of rising inventory levels and persistently high mortgage rates. As of the end of this year, Zillow projects the average mortgage rate for a 30-year fixed loan will hover around 6.5%.
This forecast does not signal a housing market crash akin to the one experienced in 2008. Instead, Zillow's analysis indicates that while some markets may see price declines, others will continue to experience growth. The overall picture is complex, with regional variations playing a critical role.
Housing Supply and Demand Dynamics
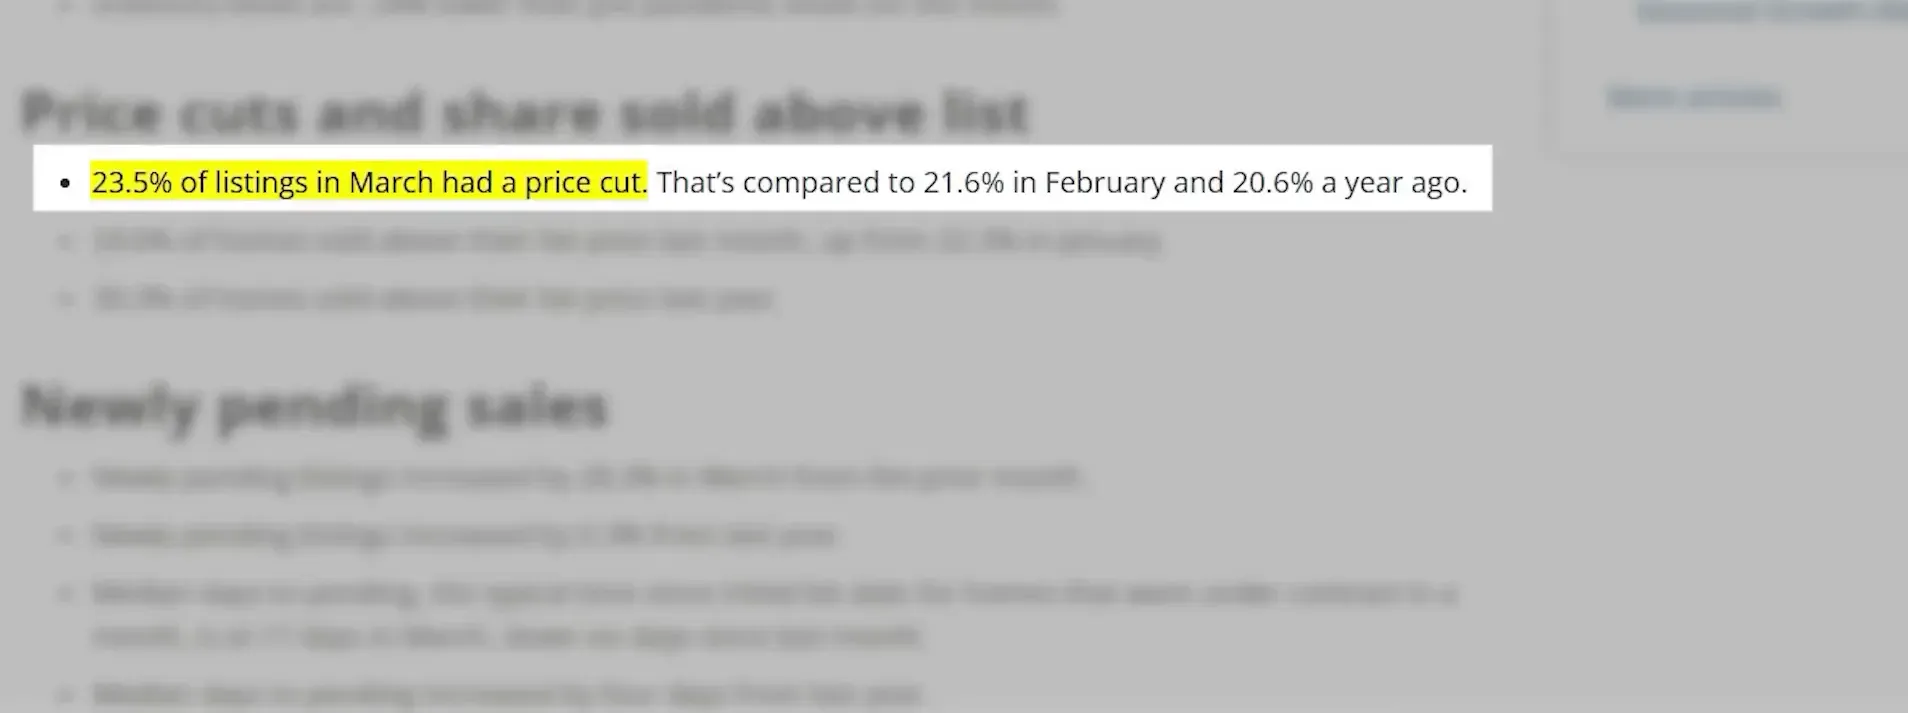
One of the key factors influencing Zillow's forecast is the current state of housing supply. The company notes a significant increase in available listings, which translates to more options for buyers. As a result, sellers are compelled to reduce prices to attract potential buyers. In March of this year, approximately 23.5% of homes for sale in the United States experienced price cuts, a rise from 21% in February and 20.6% a year ago. This trend underscores a shift towards a more balanced market, where buyers have increased leverage.
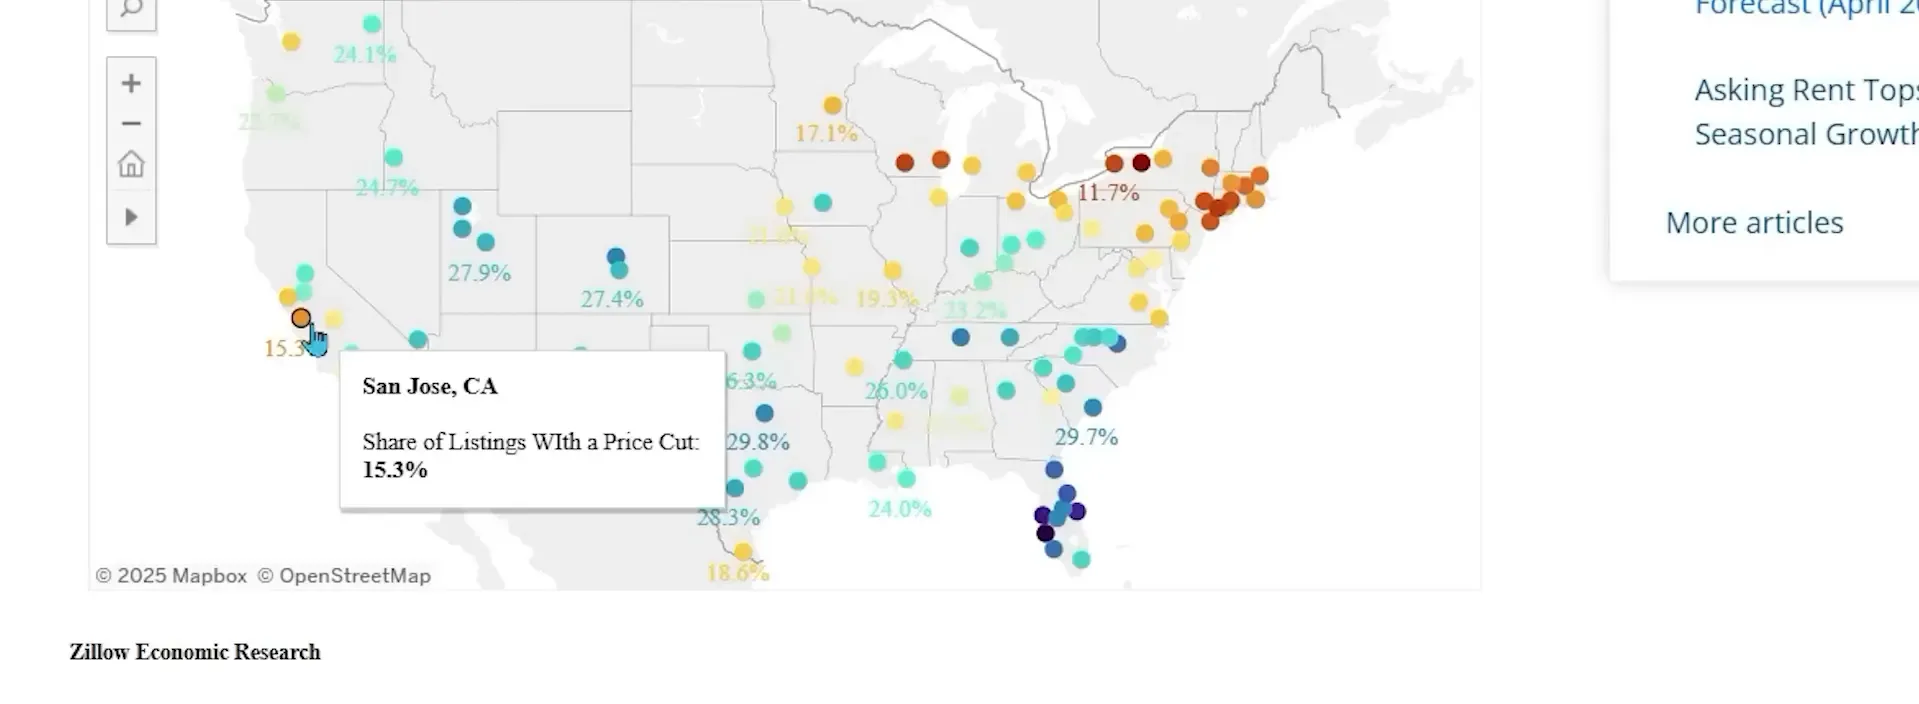
However, it is essential to recognize that not all markets are experiencing the same dynamics. For instance, in Sacramento, California, the percentage of homes with price cuts aligns with the national average, hovering around 24%. In contrast, areas like San Jose, California, and parts of Florida are still experiencing robust price increases, with price cuts significantly lower than the national average.
Regional Variations: A Closer Look
To understand the housing market better, it is crucial to examine specific regions and their performance. For example, in Phoenix, Arizona, the share of price cuts is notably higher, standing at 37%. Meanwhile, cities in Florida, such as Tampa and Northport, show similar trends, with price cuts at 34% and 37.7%, respectively. In contrast, the Northeast, including New York and Connecticut, is witnessing a lack of price cuts, indicating less downward pressure on home prices.
This disparity in market conditions highlights the importance of localized analysis when considering real estate investment or home buying. Different cities and regions are responding uniquely to the broader economic landscape, and understanding these local nuances can aid in making informed decisions.
Comparing Current Trends to the Great Recession
When discussing housing market forecasts, it is impossible to ignore the stark differences between the current situation and the Great Recession of 2008. During that time, the market faced a severe oversupply of homes, with over 2.5 million properties available. In contrast, as of March this year, the national inventory stands at approximately 1.3 million homes for sale. This historical context is crucial in understanding why a crash similar to 2008 is unlikely.
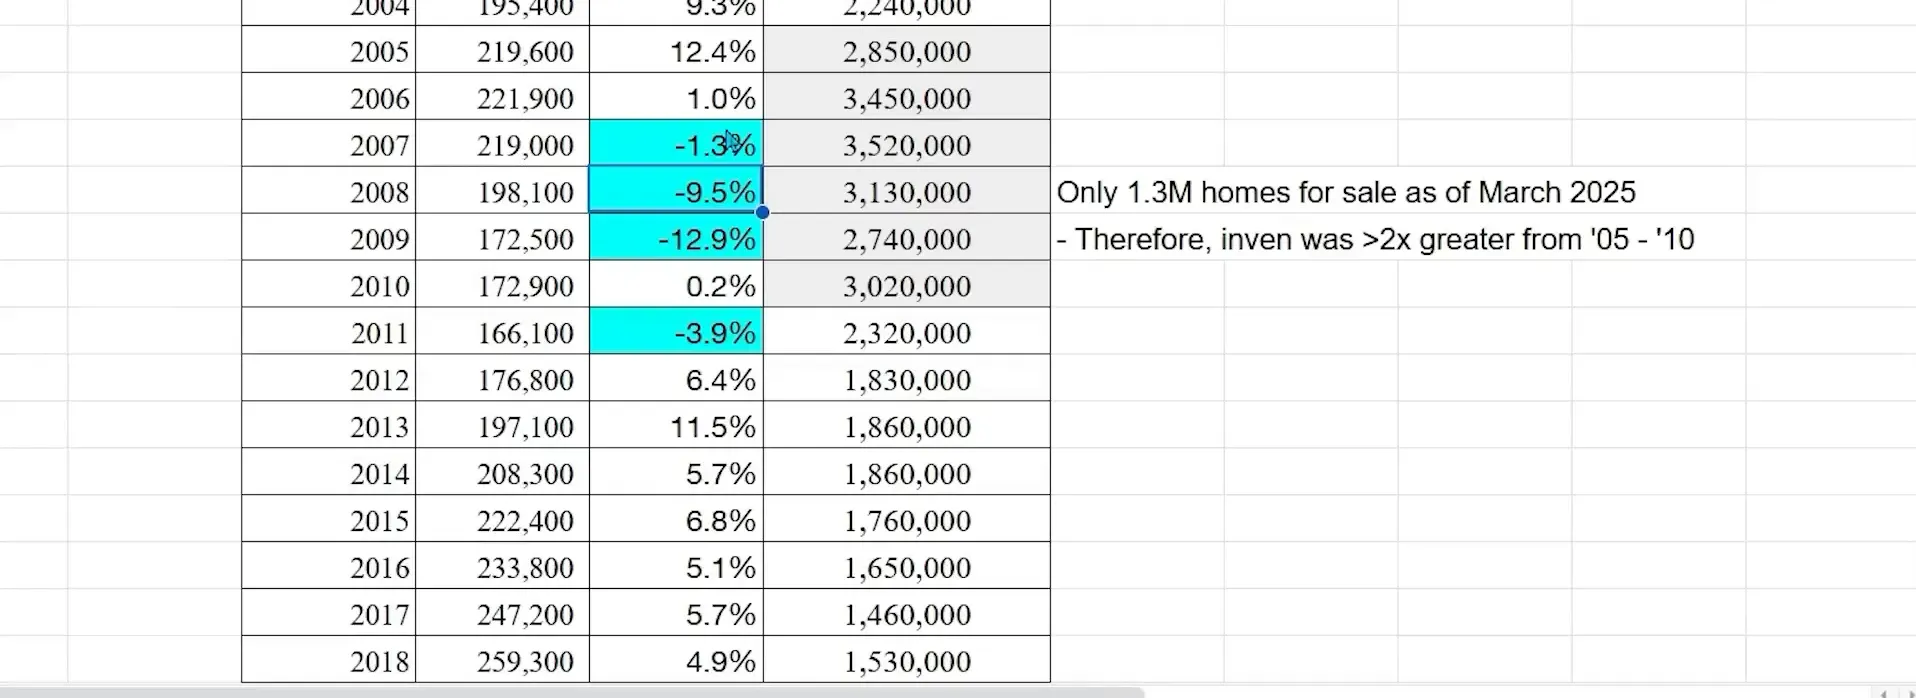
The lower inventory levels today suggest that while prices may decline in certain areas, the overall market is less susceptible to a dramatic collapse. The balance between supply and demand is a key indicator of market health, and current conditions indicate a much tighter inventory than was seen in the lead-up to the recession.
Sales Forecasts and Market Predictions
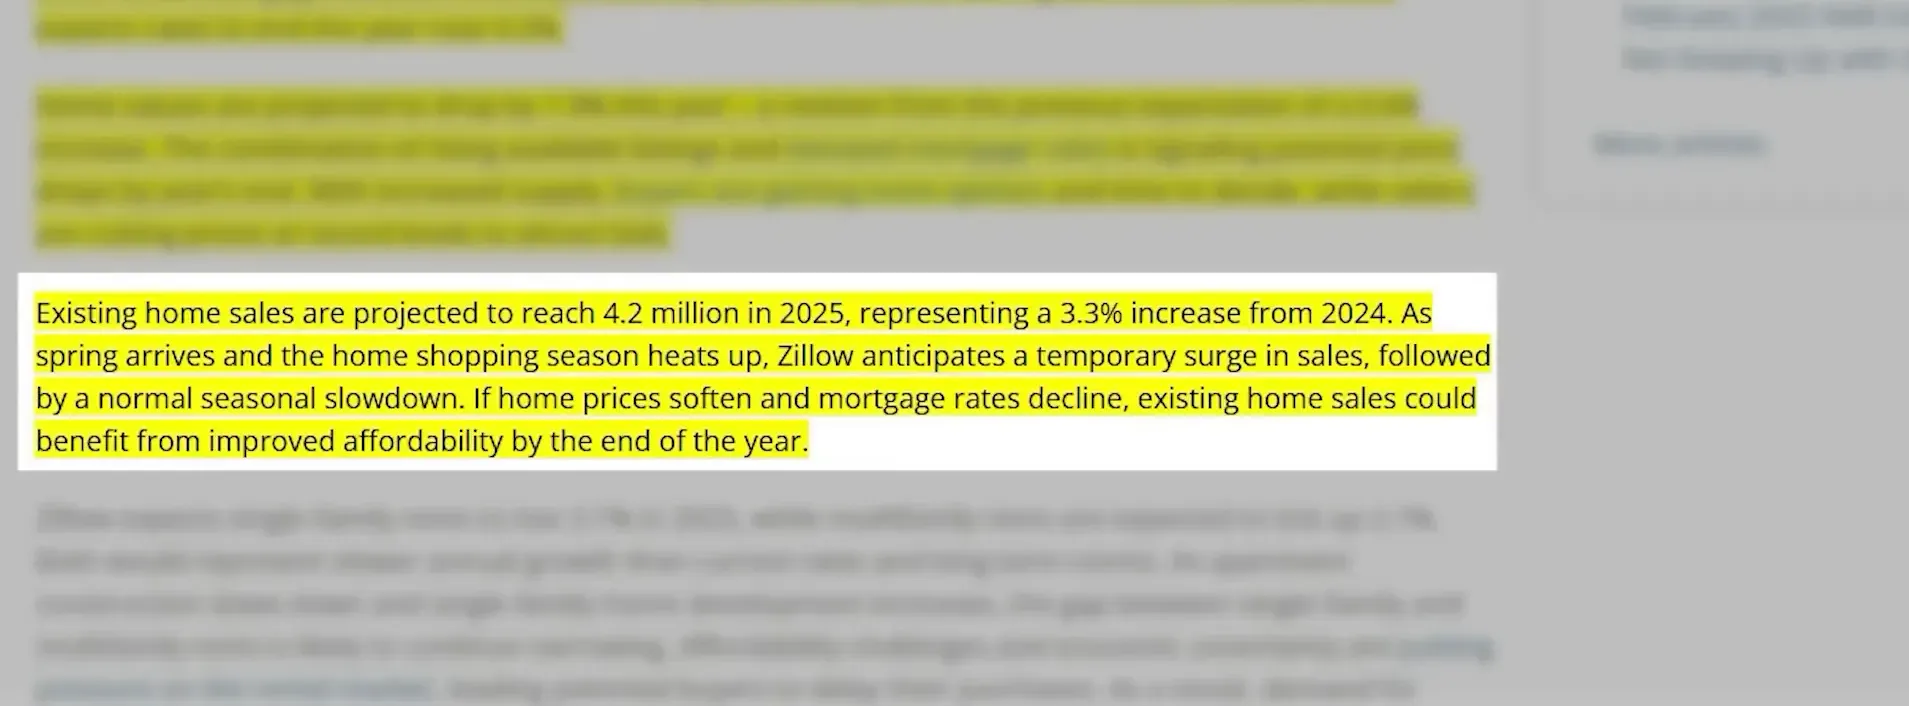
Looking ahead, Zillow projects that existing home sales will reach approximately 4.2 million in 2025, representing a 3.3% increase from the previous year. This projection reflects a seasonal trend in the housing market, where sales typically surge in the spring before tapering off in the winter months. If home prices soften and mortgage rates decrease, there is potential for improved affordability, which could further boost sales.
However, it is essential to contextualize this forecast within historical data. The projected sales figures remain significantly below the historical average of around 5 million annual sales since 1989. This discrepancy indicates a potential long-term shift in the market, where lower transaction volumes could become the norm.
Comparative Analysis with Other Forecasts
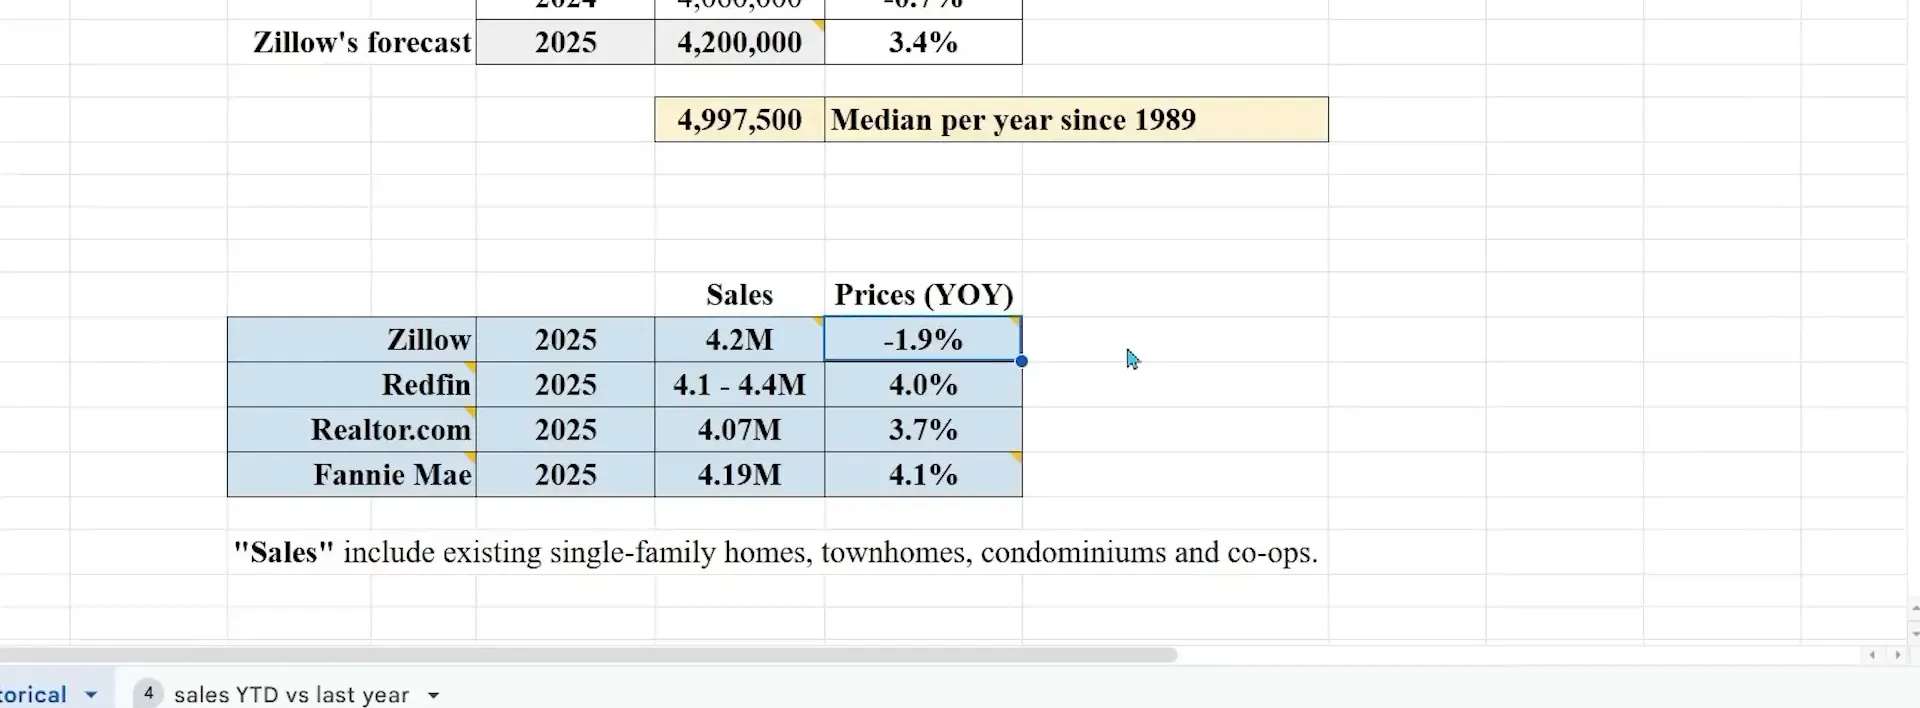
Zillow's predictions are not made in isolation; they align with or diverge from forecasts issued by other real estate companies such as Redfin, Realtor.com, and Fannie Mae. For instance, Redfin and Realtor.com previously predicted home sales of around 4.1 to 4.4 million, with price increases of 4% and 3.7% respectively. Conversely, Fannie Mae's recent forecast aligns closely with Zillow, projecting existing home sales just under 4.2 million while expecting a price increase of 4.1%.
The varying predictions highlight the uncertainty inherent in real estate forecasting, emphasizing the need for buyers and investors to remain vigilant and informed about market conditions.
Key Metrics to Monitor
For anyone looking to navigate the current housing market, understanding which metrics to track is vital. Here are some essential indicators to keep an eye on:
- Inventory Levels: Tracking inventory levels can provide insight into market dynamics. Increasing inventory often signals a shift towards a buyer's market, while decreasing inventory can indicate a seller's market.
- Price Cuts: Observing the percentage of homes with price cuts can help gauge market pressure. A high percentage often indicates that sellers are struggling to attract buyers.
- Mortgage Rates: Keeping abreast of mortgage rate trends is crucial, as these rates directly affect affordability and buyer demand.
- Local Market Conditions: Each market has its unique characteristics. Researching local trends can provide a clearer picture of what to expect in specific areas.
Conclusion
The housing market is undergoing significant changes, with Zillow's updated forecast for 2025 indicating a decline in home values. However, this does not equate to a repeat of the Great Recession; instead, it reflects a more balanced market with regional variations. By understanding the key metrics and monitoring market trends, buyers and sellers can navigate this evolving landscape effectively.
For more insights into Utah's real estate market, visit Best Utah Real Estate.
FAQs
What factors are contributing to the decline in home values?
The decline in home values is primarily attributed to rising inventory levels and high mortgage rates, which together shift market dynamics toward a more balanced environment.
How does the current housing market compare to the 2008 recession?
Unlike the 2008 recession, which was characterized by a significant oversupply of homes, the current market has lower inventory levels, making a crash less likely.
What should buyers look for in the current market?
Buyers should monitor inventory levels, price cuts, and mortgage rates to make informed purchasing decisions.
Are there any regions where home values are still increasing?
Yes, certain markets, such as San Jose, California, and parts of Florida, continue to see home value increases despite overall trends suggesting declines.
Frequently asked questions
What factors are contributing to the decline in home values?
How does the current housing market compare to the 2008 recession?
What should buyers look for in the current market?
Are there any regions where home values are still increasing?
Keep reading
More from the blog

Why Speed-To-Lead Wins in Competitive Housing Markets

Why Utah Investors Are Turning to Dominica Real Estate in 2026

How Fast Water Damage Can Turn Into Mold Problems