Utah Real Estate 2025: Cooling Market, Rising Distress — Not a 2008-Style Crash
Utah's housing market in late 2025 is showing clear signs of cooling compared with the frenzy of 2021 through 2023, but it is not repeating the widespread collapse experienced in 2008.
Utah's housing market in late 2025 is showing clear signs of cooling compared with the frenzy of 2021 through 2023, but it is not repeating the widespread collapse experienced in 2008. Markets across the state are settling into more balanced dynamics: some regions are neutral, a few are tilting toward buyers, inventory has increased, and foreclosure activity is rising from recent lows but remains far below the levels seen during the last crash. This analysis summarizes the numbers driving those conclusions, explains what is creating current stress for some homeowners, and outlines practical strategies for buyers, sellers, and investors.
Regional Heat-Map: Neutral or Tilting Toward Buyers
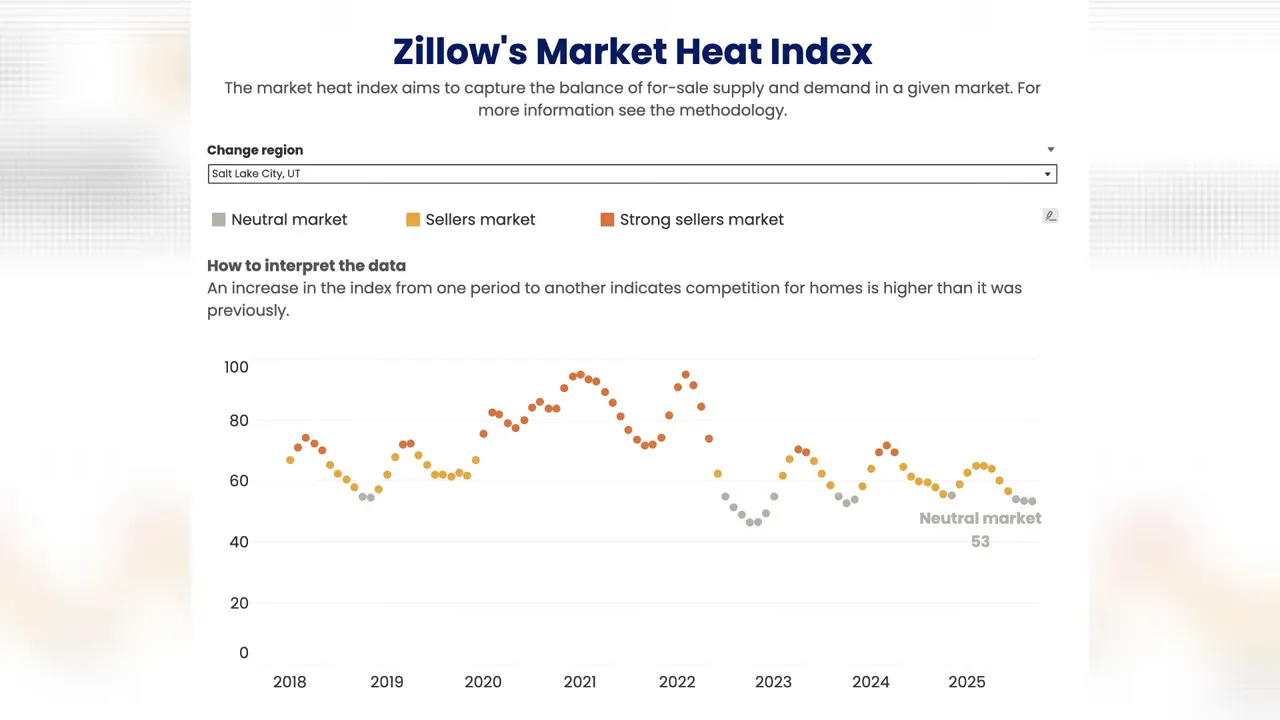
Zillow’s local heat index provides a quick way to read supply and demand at the metro level. Most Utah metros are classified as neutral markets, meaning neither buyers nor sellers have a persistent advantage. Key readings include:
- Salt Lake City metro: A neutral market score in the low 50s, down from the strong seller conditions of 2021–2022.
- Provo region: Slightly stronger than Salt Lake, but still neutral with a score around the mid-50s.
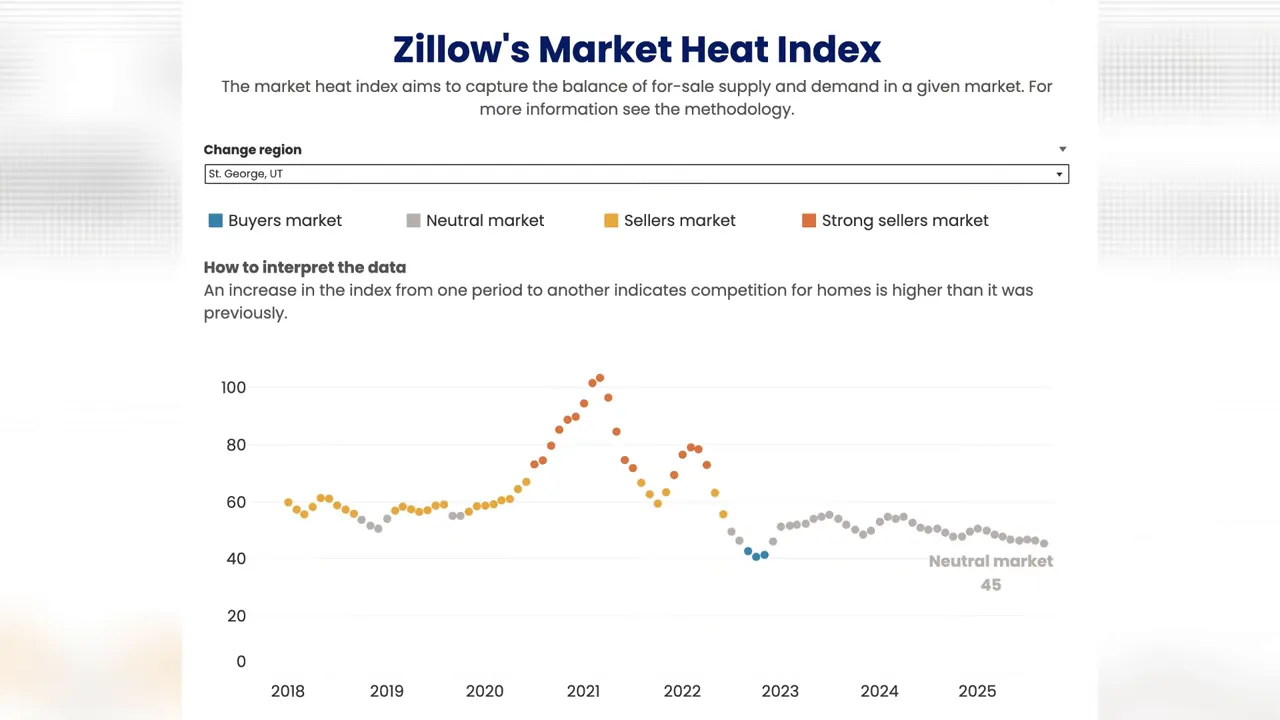
- St. George (southern Utah): Hanging near the neutral/buyer boundary with a score in the mid-40s.
- Logan: Recently moved into a buyer’s market, just below the neutral threshold.
Neutral market conditions mean more give and take during negotiations: sellers may offer closing-cost assistance and buyers may secure homes near or below list price. Markets with prolonged buyer advantages will show further price pressure and longer days on market.
Foreclosures and Notices of Default: Rising but Not a Crash
Foreclosure activity has increased compared with the immediate post-pandemic trough. Several months in 2025 have registered over 100 notices of default statewide, including August, September, and October. A targeted look at three major counties—Salt Lake, Utah, and Davis—found 91 active or under-contract listings with special conditions such as notices of default or short-sale status as of November 6, 2025.
Important context:
- Utah’s 2008 peak recorded roughly 18,657 notices of default for the year. Current annual totals remain far below that level; statewide sales of distressed properties in 2025 were around the low hundreds through early November.
- Year-over-year growth in distressed sales is evident: the three-county group recorded 87 distressed closings year-to-date in 2025 compared with 69 in 2024, 32 in 2023, and 11 in 2022.
- Many distressed listings trace back to purchases made in 2022–2023, when buyers commonly paid premiums and relied on temporary mortgage rate buydowns. As those buydowns expire and mortgage payments normalize, payment stress is contributing to the uptick in notices.
Inventory, Prices, and Sales Velocity
Inventory across Utah is higher than a year ago, with more than 13,000 active listings reported on common statewide portals in early November 2025. Higher inventory generally eases upward price pressure, but the interaction between fewer closed sales and price trends has been complex in 2025.
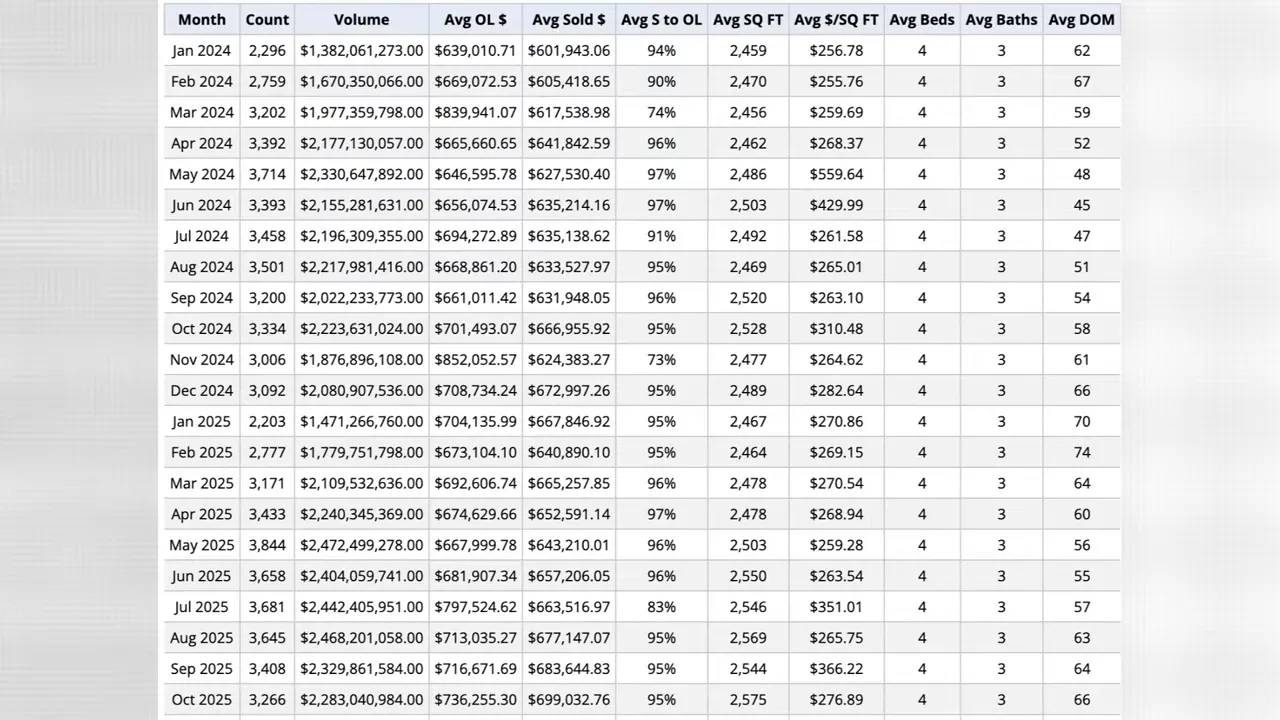
October comparisons highlight that complexity:
- Fewer closed transactions in October 2025 compared with October 2024.
- Average sold price rose from about $667,000 in October 2024 to roughly $699,000 in October 2025.
- Days on market increased year over year, consistent with a more balanced market and slower buyer urgency.
Those numbers suggest slower turnover and longer marketing times, but not a uniform price collapse. Markets with strong local demand, constrained supply of specific product types, or desirable neighborhoods can still push average prices higher even as overall sales volume declines.
Demographics and Buyer Behavior: A Long-Term Shift
National buyer and seller demographics are influencing Utah’s market dynamics. Recent national reports from industry sources such as the National Association of Realtors indicate that sellers are staying in their homes longer—about 11 years on average—and that the median age of first-time buyers has climbed to around 40. The median down payment for first-time buyers has also reached levels not seen since the late 1980s, at roughly 10 percent.
Two consequences follow:
- Delaying first-time purchases by a decade can materially reduce lifetime home equity; industry estimates place the typical difference around the order of six figures for starter homes over a 10-year delay.
- Higher median down payments and older buyer profiles shift demand patterns toward larger purchases or more established neighborhoods, which affects inventory composition for entry-level product.
National data sources: nar.realtor and state resources such as utah.gov provide ongoing market and housing-statistics releases for deeper research.
What This Means for Buyers, Sellers, and Investors
- Buyers: First-time buyers and move-up buyers have more negotiating room than during 2021–2023. Focused searches for townhomes and condos can yield opportunities where days on market are high and price reductions are more common. Budget for current mortgage rates and be mindful of how temporary buydowns may expire on resale.
- Sellers: Homes purchased at market peaks may sell for less than the purchase price in the short term. Sellers should price realistically, highlight value through staging and repairs, and be prepared to offer concessions such as closing-cost assistance in neutral markets.
- Investors: Elevated inventory and localized distress present selective acquisition opportunities. Thorough due diligence on purchase timing, financing structure, and exit strategies is critical. Areas with consistent job growth and constrained long-term supply remain the strongest bets.
Practical Strategies for the Next 6 to 12 Months
- Stress-test affordability scenarios: simulate mortgage payments with current rates and without temporary buydowns to assess long-term payment ability.
- Target neighborhoods with resilient demand: proximity to employment centers, transit, and quality schools tends to preserve value.
- For sellers, invest in high-return, visible improvements and set price expectations based on comparable active and pending sales, not 2022 peak prices.
- Monitor foreclosure filings and local notices of default as early-warning signals; rising filings in a specific ZIP code can presage increased inventory and downward pricing pressure there.
- Keep an eye on monetary-policy moves and how mortgage markets react; cuts from central banks do not always translate immediately to lower mortgage rates.
Where to Find Trustworthy Utah Housing Data
For statewide MLS summaries and searchable listings, visit bestutahrealestate.com for regularly refreshed inventory counts and market pages. For national reports and buyer-seller demographics, refer to nar.realtor. For official state-level housing programs and resources, see utah.gov.
Frequently asked questions
Is Utah headed for a housing crash similar to 2008?
Current data show rising distress and higher inventory compared with recent years, but foreclosure volumes remain a fraction of 2008 levels. The 2008 crisis involved systemic problems across mortgage underwriting and global finance; present indicators point to localized stress tied to rate buydown expirations and price peak exposure rather than a nationwide collapse.
Which Utah regions are favoring buyers right now?
Smaller metros and resort-adjacent markets are more likely to tilt toward buyers. Recent heat-index readings place Logan in a buyer's market and St. George near the buyer-neutral boundary, while Salt Lake City and Provo remain broadly neutral.
Are foreclosures increasing and should buyers expect many distressed opportunities?
Foreclosure-related listings have increased from recent lows, and certain counties are showing meaningful year-over-year rises. However, totals remain far below 2008 levels, so distressed inventory will be a moderate, not overwhelming, share of the market for most buyers.
Is it better to wait to buy until mortgage rates drop further?
Timing the market and interest rates is uncertain. Buyers focused on long-term homeownership should balance current affordability, local inventory opportunities, and personal financial readiness. Buyers uncomfortable with today's rates may consider larger down payments, rate buy-down options where available, or adjustable-rate products with clear exit plans.
Where can more localized Utah housing guidance be found?
State and national sources provide reliable datasets: utah.gov for local housing resources and nar.realtor for national buyer-seller trends. For regularly updated local listings and market summaries, consult https://bestutahrealestate.com.
Keep reading
More from the blog

Top Rated Plumbing Companies in Southern Utah for 2026

How to Measure Long-Term Real Estate Appreciation

Resort Booking & Operations Software: A Seasonal Rental Guide